


Redpanda pushes the envelope on NVIDIA Vera
Benchmark shows Vera provides 5.5x lower latencies and up to 73% higher throughputs than other leading CPU models
47% lower latencies using 15% less CPU means better performance for intensive workloads


For Redpanda Streaming 26.1, we investigated optimizing the Redpanda binary with clang’s compiler-based profile-guided optimization (PGO) and also using LLVM BOLT.
While PGO has been around for a while, it’s still only selectively deployed. BOLT is a newer technology that originated as a 2019 research project at Meta and is now part of LLVM.
PGO and BOLT are similar technologies that further optimize the application binary based on profiling data. Compilers traditionally struggle to determine which code paths are hot and executed frequently, since they rely on heuristics and guesswork. With profiling data, no guessing is needed; optimization decisions can be made based on the profile.
In this post, we look at the operational challenges these technologies pose, the performance gains we achieved with them, and why they can lead to significant speedups.
Both PGO and BOLT are similar in some of the optimizations they apply, but are different in how they operate.
With PGO, a two-phase compilation process is employed. In the first step, the binary is compiled with extra instrumentation, and then a representative training workload is run against it to produce profile data. This is then used in a second recompilation to enable better, more targeted optimization.
BOLT, however, is a post-link binary optimizer. It operates directly on the binary produced by the original compilation process, rewriting code sections in the output binary. There is no interaction with the compiler or additional compilation steps.
Both technologies come in two modes:
perf tool). Each approach has its advantages and disadvantages. BOLT’s approach to operating on the binary directly avoids an extra compilation step, potentially saving significant build time. This can be especially important for larger projects like Redpanda Streaming. At the same time, its binary-modifying nature is quite brittle, and we ran into a few bugs (like this one).
While the compile-time overhead of PGO is a disadvantage, it can be mitigated by enabling PGO only where it’s really needed. Granted, PGO is a proven and widely deployed technology, so with this in mind and considering some outstanding BOLT bugs, we decided to stick with PGO.
Note that they’re not mutually exclusive. Many combine PGO and BOLT for the best performance, and we’ve seen this during our own tests. (We’ll likely return to adding BOLT on top of PGO at some point.)
PGO significantly improves CPU-bound performance. The numbers below come from one of our core regression benchmarks that simulate high request rates with small batch sizes. This workload is deliberately CPU-intensive, mirroring real-world patterns where significant processing overhead is applied to relatively small amounts of data.
The result? A massive drop in latency.
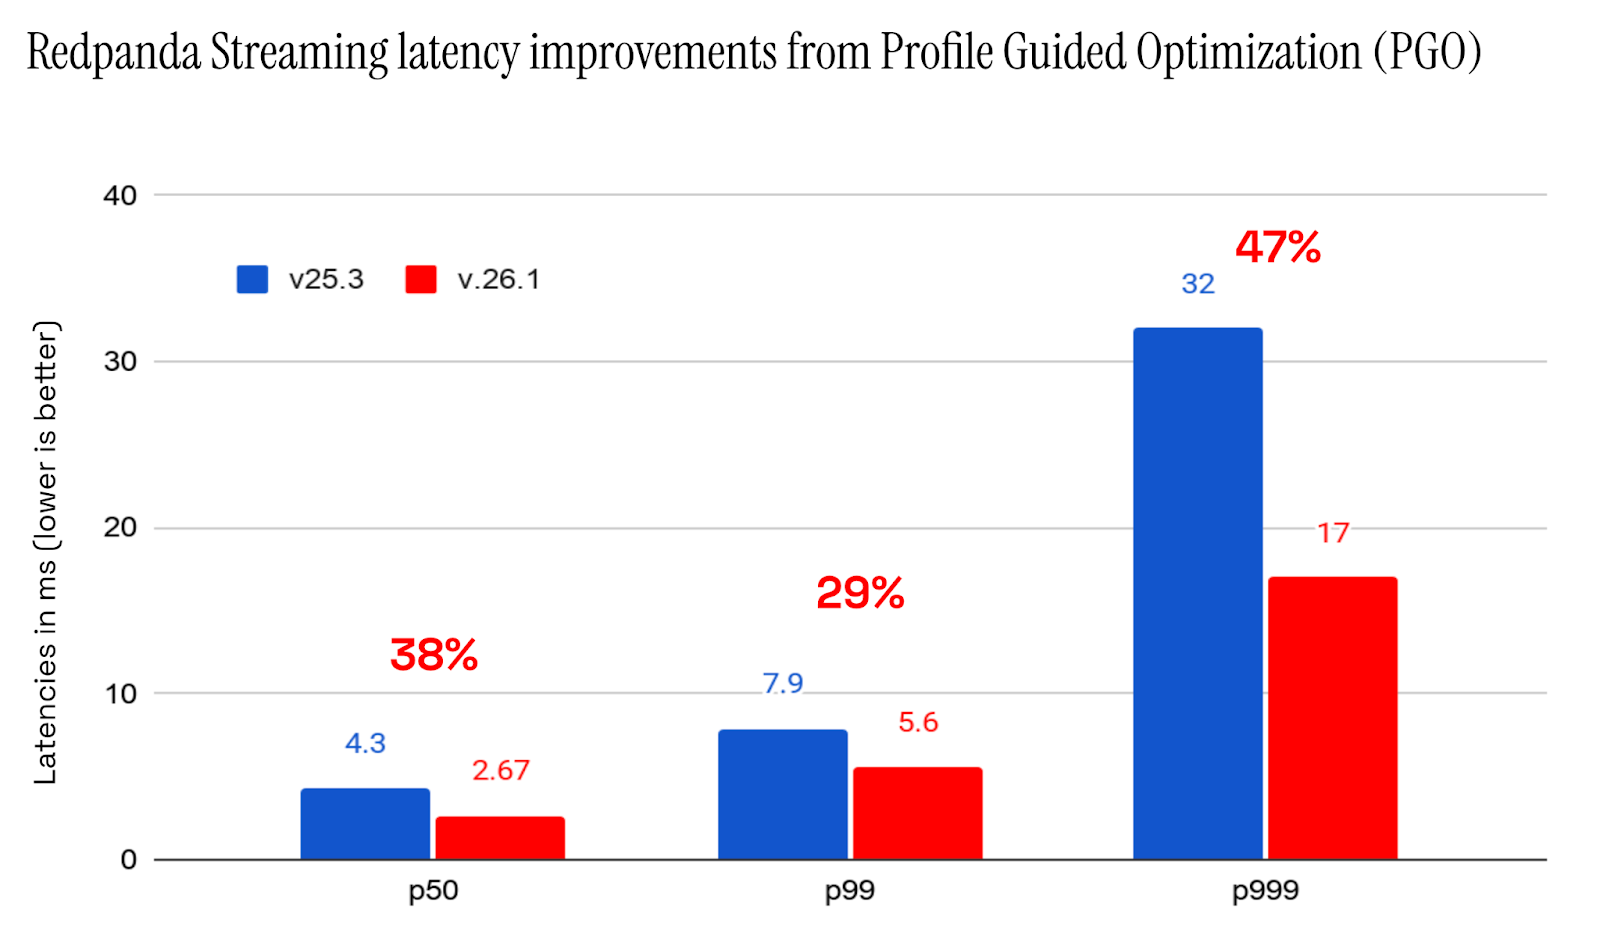
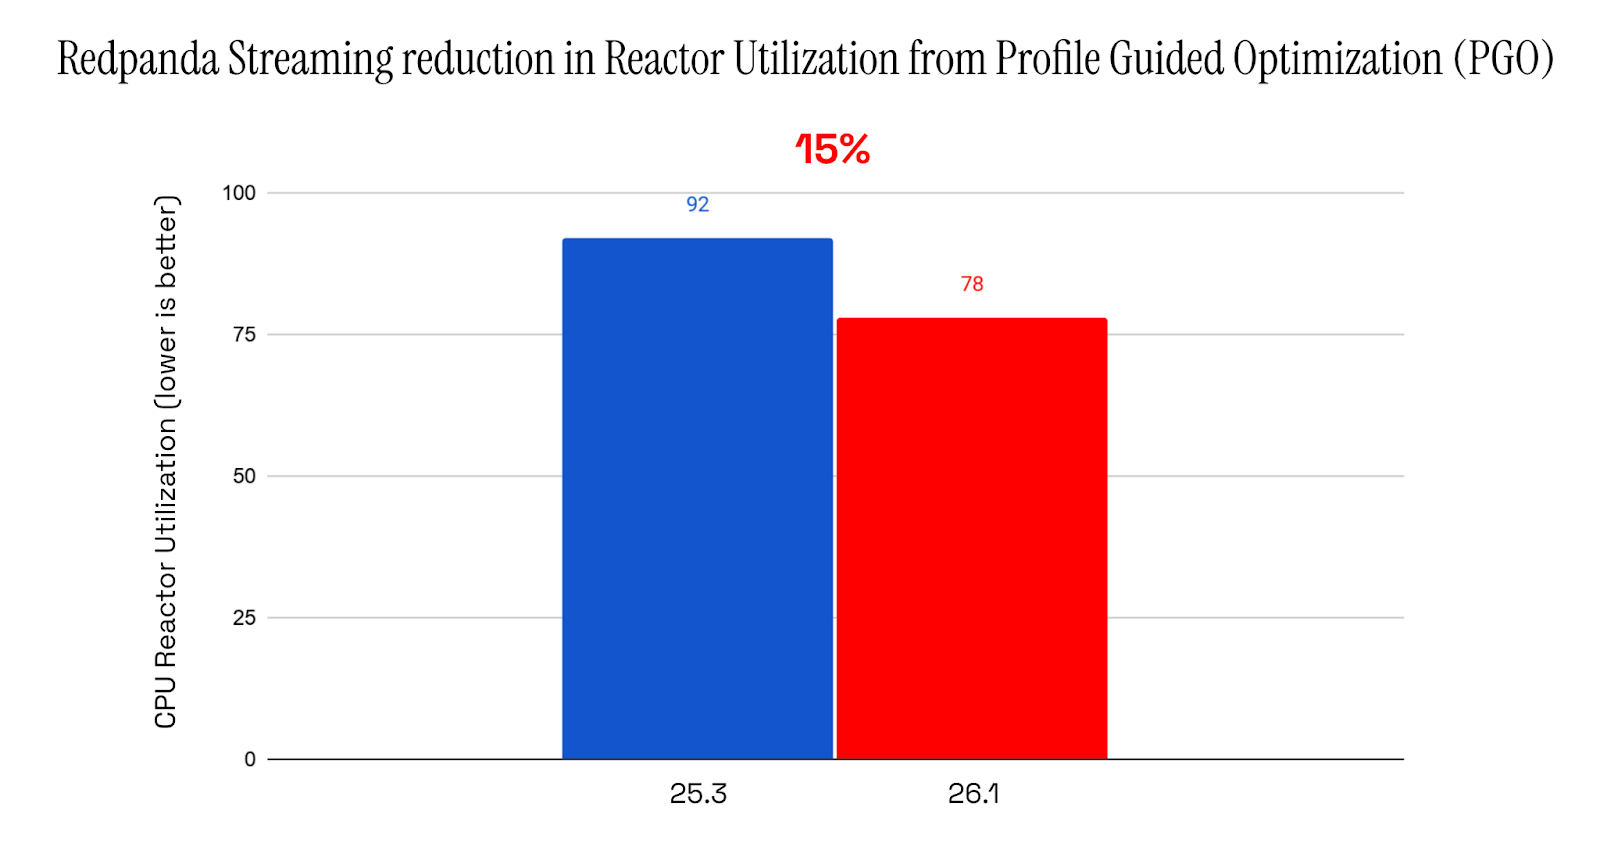
As you can see, the 50th percentile latency drops by almost 50%, with a further 15% drop in CPU utilization.
For those interested in how a reduction in CPU utilization can result in an overproportional reduction in latency: systems like Redpanda Streaming and Apache Kafka® have inherent batching, both explicitly in the API via Kafka producer settings (like linger.ms) and implicitly in the broker. Batching requests is more efficient and allows the broker to trade higher latency for higher throughput.
We also investigated BOLT's performance and found it to show improvements similar to PGO. Most of the time, it came in just slightly behind. We also tested combining the two and got another small bump in performance.
To dig deeper into how PGO can help, we wanted to narrow down where the performance speedup actually comes from.
In our benchmark, we ran a top-down performance analysis (TMA). For context, a traditional profiler shows what parts of our application are slow. However, a profiler doesn’t tell us why a bit of code is slow on a CPU level. This is where TMA comes in.
TMA uses hardware performance counters exposed by the CPU to measure exactly where a CPU stalls while executing the measured part of the code. It operates top-down, starting at a very high level and only then drilling down into affected areas and CPU components. This avoids getting lost in individual performance counters.
CPU time is split into four major categories.
Looking at the TMA results for our benchmark using the Linux perf tool, we see the following:
$ sudo perf stat --topdown --td-level 1 -t $(pidof -s redpanda)

Performance counter stats for thread id '3275312':

% tma_frontend_bound  % tma_bad_speculation  % tma_retiring  % tma_backend_bound
                51.0                   10.3            30.9                  7.8
Redpanda Streaming is very frontend-bound in this benchmark. Being 50% frontend bound is definitely on the higher end, even for database or distributed applications.
Now, let’s compare it against the numbers in the PGO-optimized build:
$ sudo perf stat --topdown --td-level 1 -t $(pidof -s redpanda)

Performance counter stats for thread id '4043061':

% tma_frontend_bound  % tma_bad_speculation  % tma_retiring  % tma_backend_bound
                37.9                    9.5            36.6                 16.0
Good progress. The CPU is still frontend-bound, but less so than before. Crucially, the retiring percentage has increased, meaning more work is actually being completed. Some frontend stalls have shifted to backend stalls, which is expected: resolving one bottleneck often reveals the next.
To clarify, frontend-bound means the CPU can't load instructions fast enough for the backend to execute. The root cause is code locality: the hot path is scattered across the executable rather than packed tightly together. This fragments the instruction cache, leading to high-latency memory fetches.
PGO addresses this directly. Using profile data, the compiler identifies which functions and branches are hit most often, then reorganizes code accordingly by grouping hot blocks together and splitting functions into hot and cold segments. Inlining decisions are also profile-driven, allowing frequently called functions to be inlined more aggressively.
We can see these layout optimizations in action by visualizing code block access frequency across our binary. BOLT provides a tool to generate this heatmap from a workload profile, making it straightforward to compare our standard binary against the PGO-optimized version.
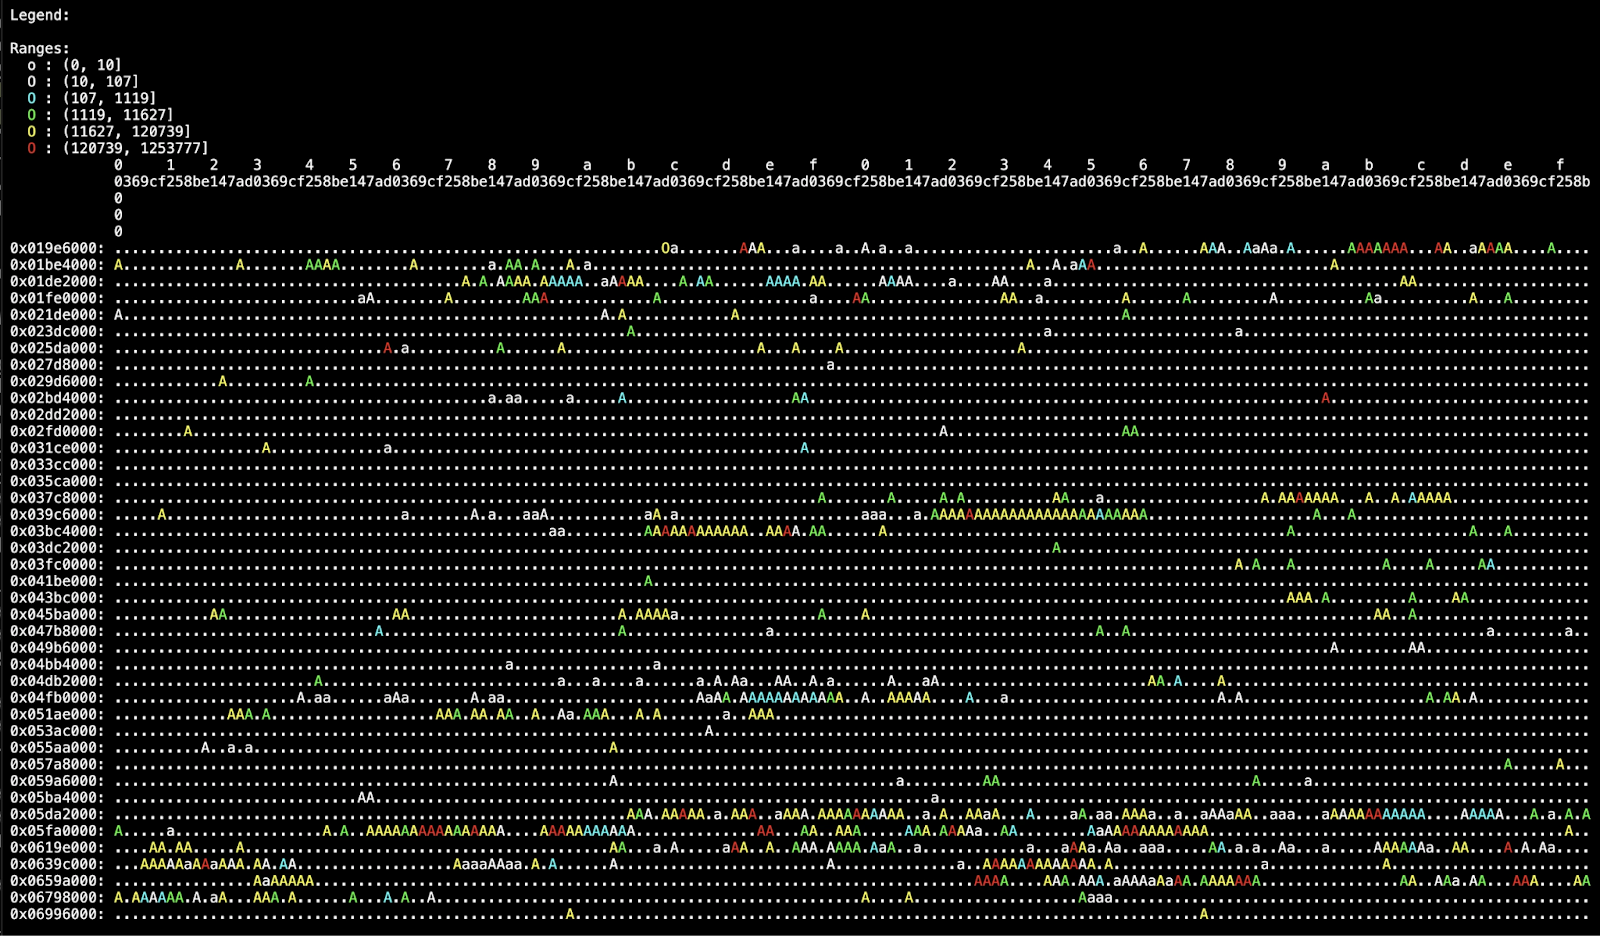
Each dot in the heatmap represents 12KiB of code in the binary. Here’s the breakdown:
We see that access is scattered throughout the binary. While there are bands of hotter code, there are many individual hot chunks. Things look much different on the PGO heatmap.
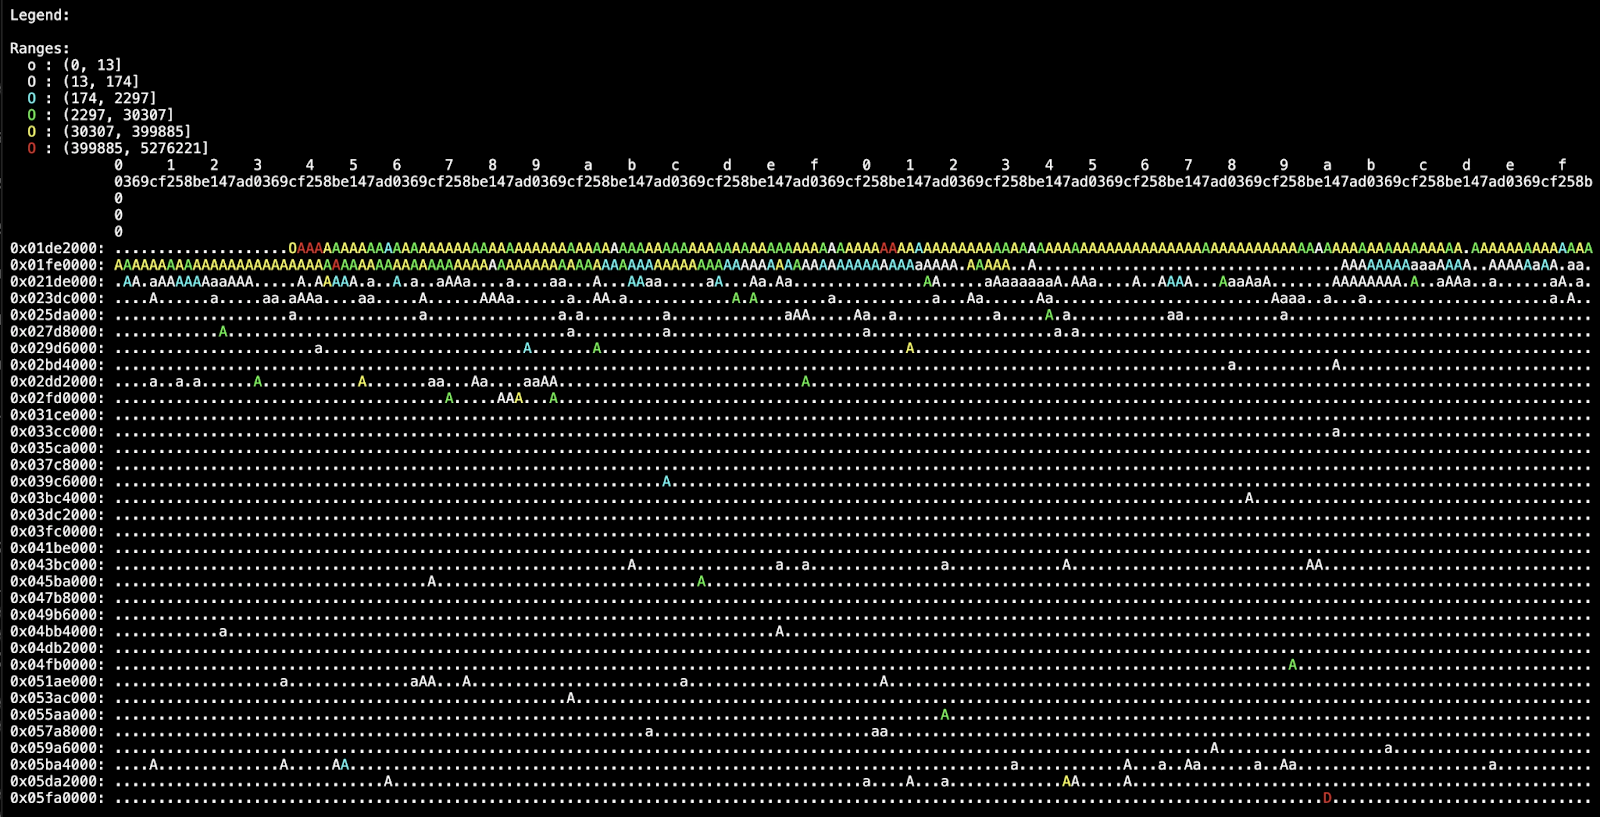
The heatmap shows a clear improvement. In the PGO-optimized binary, all hot functions are packed tightly at the start of the binary, not because the start is special, but because hot code is now concentrated in one place rather than scattered. Access to the rest of the binary is minimal.
The heatmap legend is key here: yellow is significantly hotter in the PGO case, confirming denser, more concentrated code access despite there being less red.
This is exactly why PGO reduces frontend pressure. Tighter hot path packing improves instruction cache locality and cuts down on iTLB lookups, which means the CPU spends less time fetching code and more time executing it.
The benefits of PGO are a critical part of the 26.1 release and are immediately available to everyone using 26.1. Looking ahead, this optimization will continue to improve Redpanda Streaming’s performance, especially for CPU-intensive workloads.
We also recommend everyone give PGO and BOLT a try to help large, frontend-bound applications.If you’re ready to try Redpanda Streaming yourself, check out our deployment options or justdownload our Docker image. If you’re already a user, read what else is new. As always, if you have questions you can chat with our engineers directly on Slack.
Benchmark shows Vera provides 5.5x lower latencies and up to 73% higher throughputs than other leading CPU models

How we streamed 14.5 GB/s to Snowflake with 7.5 second P99 latency
Subscribe to our VIP (very important panda) mailing list to pounce on the latest blogs, surprise announcements, and community events!
Opt out anytime.
.png)