


Supercharging Redpanda Streaming with profile-guided optimization
47% lower latencies using 15% less CPU means better performance for intensive workloads
How we streamed 14.5 GB/s to Snowflake with 7.5 second P99 latency


When you’re monitoring fast-moving markets or running critical analytics, every second matters. Organizations can’t want to wait minutes to hours for insights.
Redpanda is known for its speed and simplicity, so we ran a benchmark to land on the highest-throughput, lowest-latency streaming data pipeline using Redpanda and Snowflake for near real-time analytics on equity market data.
Here’s the TL;DR:
To show you how we got there, we’ll walk through the setup, share benchmark results, and highlight key tuning insights so you can get the most out of your own data pipelines.
Before diving into benchmarks, let’s cover the pipeline architecture.
Redpanda is a radically efficient data streaming platform built for performance and fully compatible with Apache Kafka® APIs. For this benchmark, we deployed a 9-node Redpanda Enterprise cluster on AWS EC2 m7gd.16xlarge instances, which gave us the scale and reliability needed to handle our workload. Deployment was automated and efficient using the official Terraform and Ansible tooling.
Redpanda Connect offers 300+ pre-built connectors we can take off the shelf to compose our pipelines with little to no code.
Redpanda Connect has a snowflake_streaming connector that’s optimized for high throughput, low latency ingest use cases, which are common among Redpanda users. The connector is based on the Snowpipe Streaming API and supports schema evolution, meaning we can add new columns at will. It also allows us to parallelize, batch, and achieve exactly-once delivery.
For the benchmark, we stood up 12 Redpanda Connect nodes on AWS EC2 m7gd.12xlarge instances.
The use case was to stream messages into Snowflake table rows as fast and as close to real time as possible for downstream analytics use cases, like market surveillance. Our destination for this data was a table in a Snowflake on AWS.
Here’s an overview of how it works:
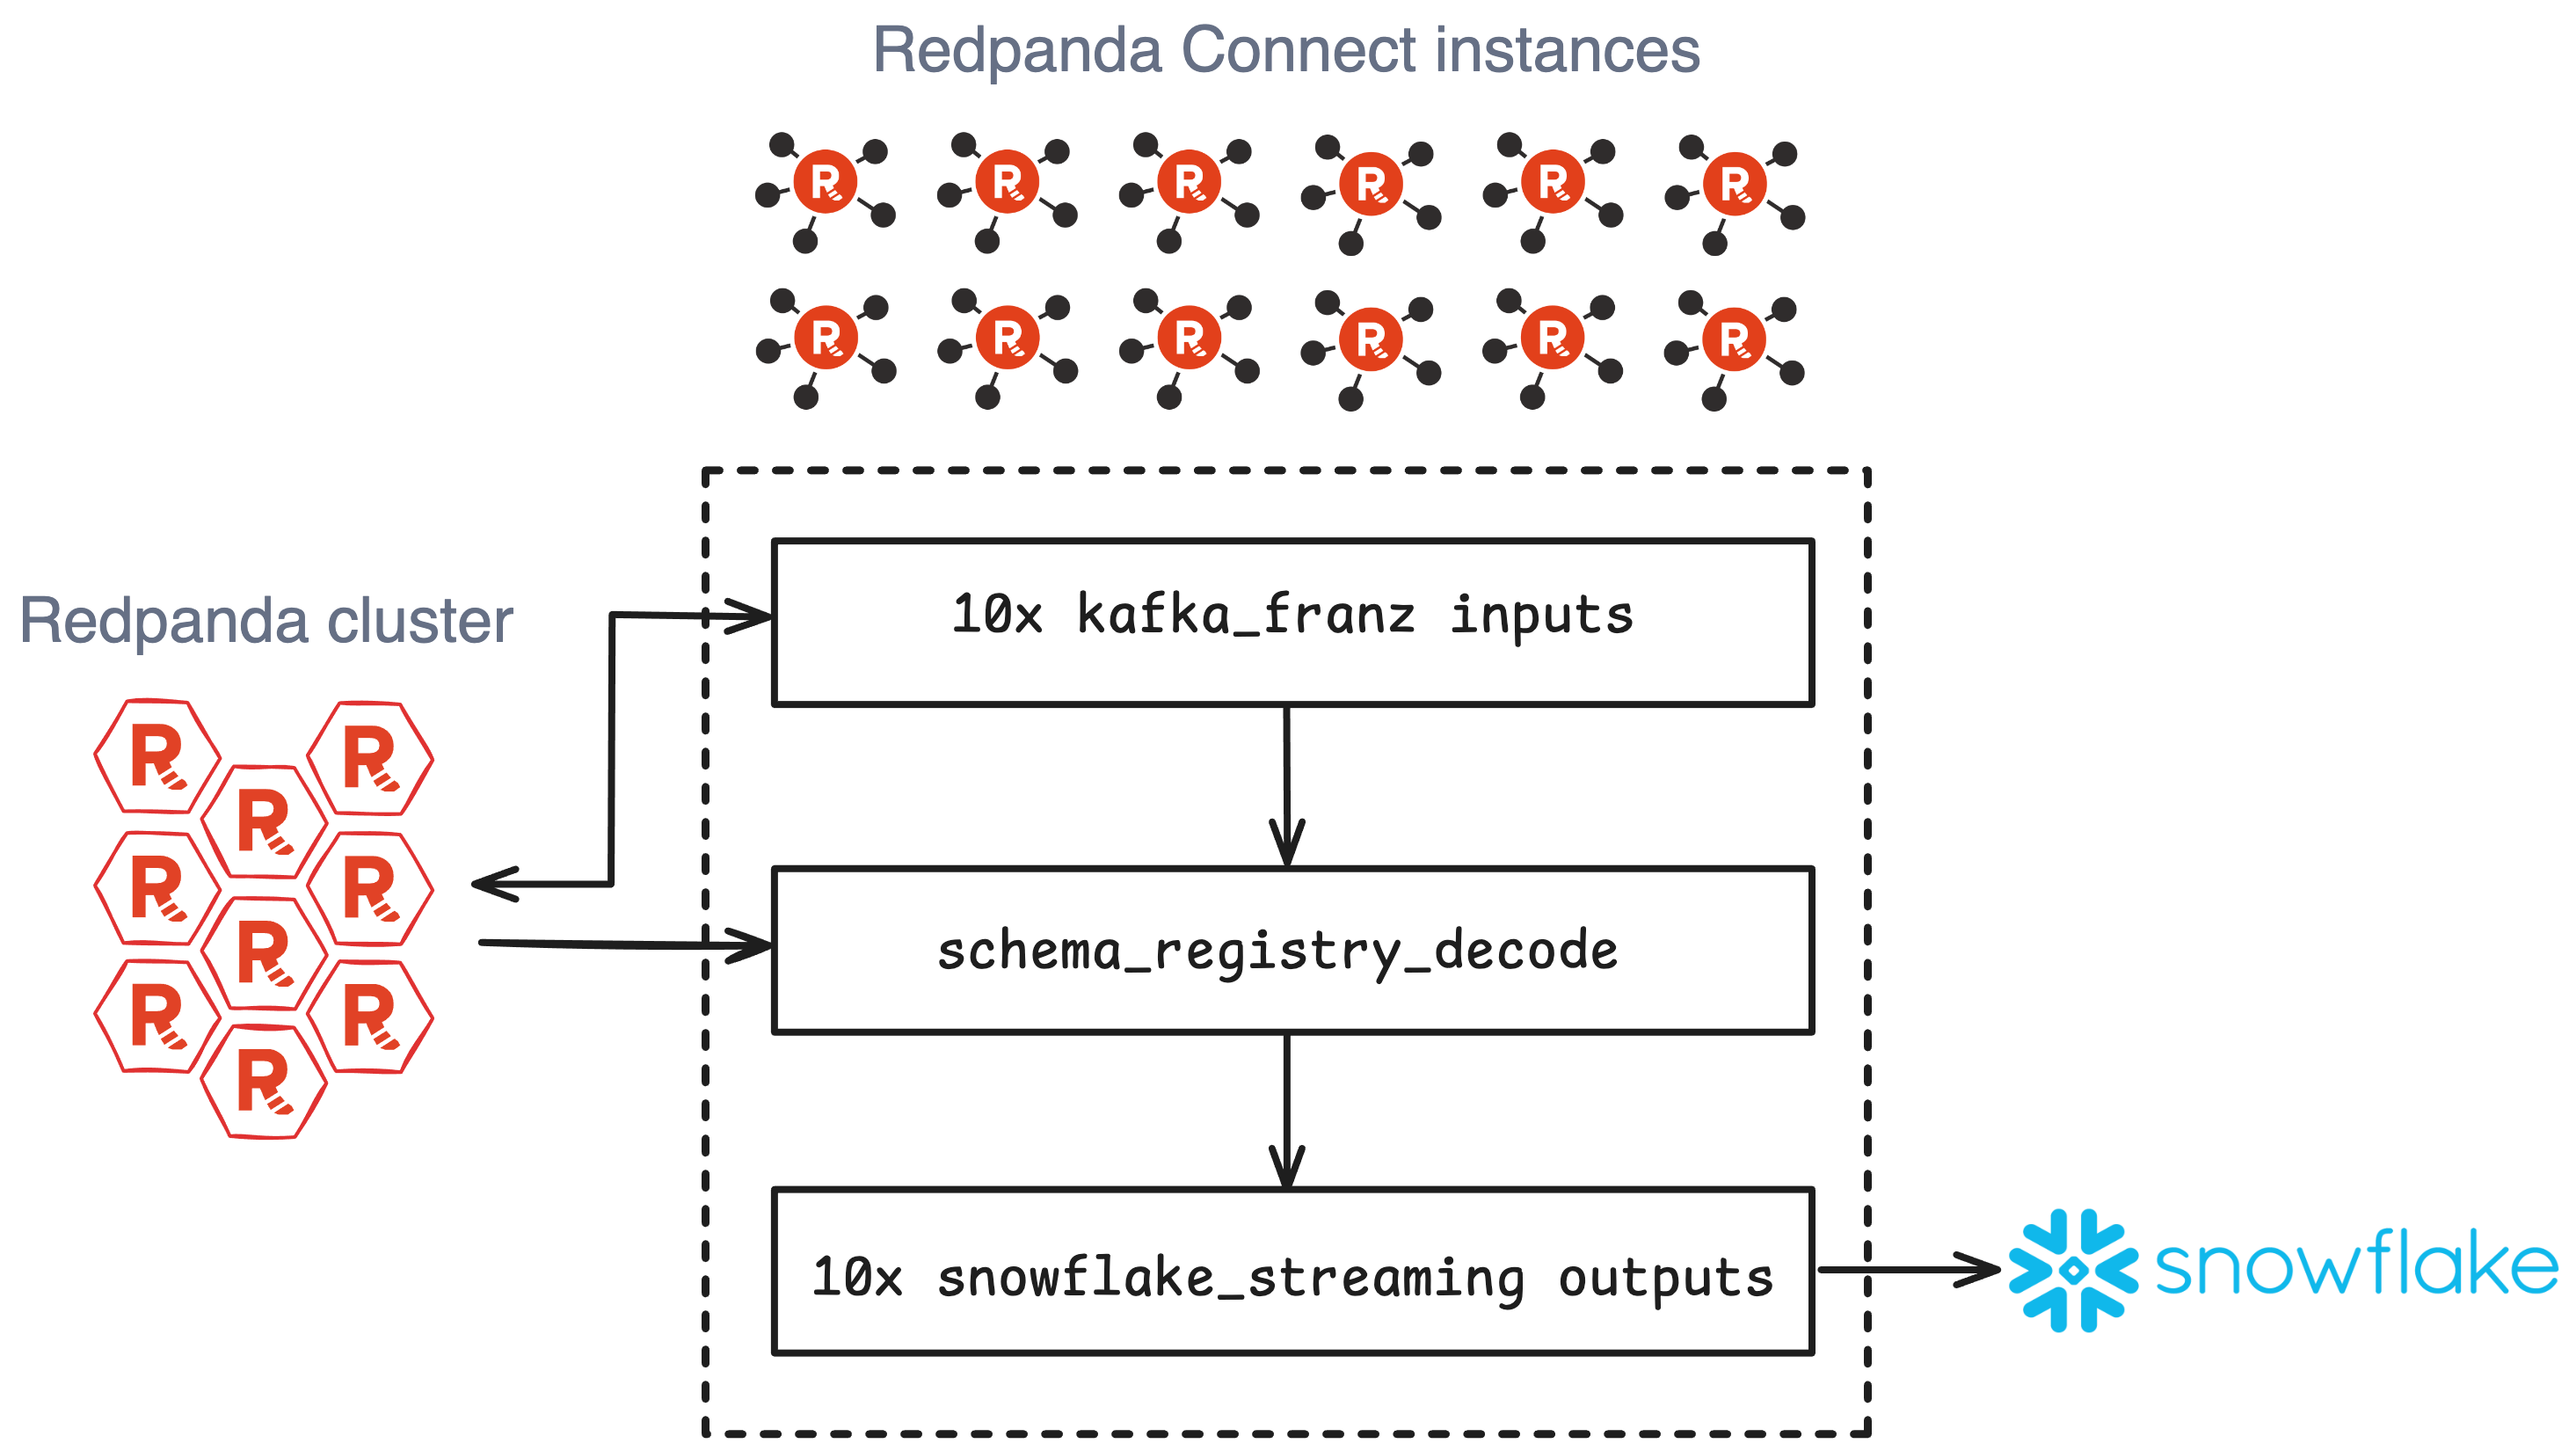
First, we created a dataset to simulate a high-volume workload by preloading a 1,200-partition topic with 3.8 billion randomized AVRO-encoded messages, each with an exact size of 1000 bytes (1 KB).
Each Redpanda Connect node was configured with a pipeline job using the kafka_franz input connector to read from the Redpanda topic and the snowflake_streaming output connector to insert rows into a Snowflake table following the defined schema.
We also used Redpanda Connect’s broker ability to parallelize the inputs and outputs on each node to fully use the system's resources and boost performance.
Check out an example of the pipeline code on GitHub.
We ran a battery of performance tests, searching for the magic combination of connector options and scaling dimensions to achieve maximum throughput and lowest latency.
Aside from a Redpanda cluster and Redpanda Connect nodes equipped with the raw compute, network, and storage resources to handle our workload, we found that what mattered most was batch settings and increasing parallelism as much as possible.
Whether that be through partition count, snowflake_streaming options, or — as it turned out — unlocking massive throughput by scaling the number of inputs and outputs within a single node.
We collected pipeline metrics with Prometheus and visualized them in Grafana over sampling windows representing the sustained peak for each test.
To create a “control group” for this experiment, we first wanted to test how our pipeline performed without Snowflake in the picture. For this, we sent messages to the drop output. We capped out at 15.1 GB/s with 8.38ms P99 latency, decoding and reading all 3.8 billion messages in five minutes total.
This became our target: how close to these numbers could we get when streaming this data to Snowflake?
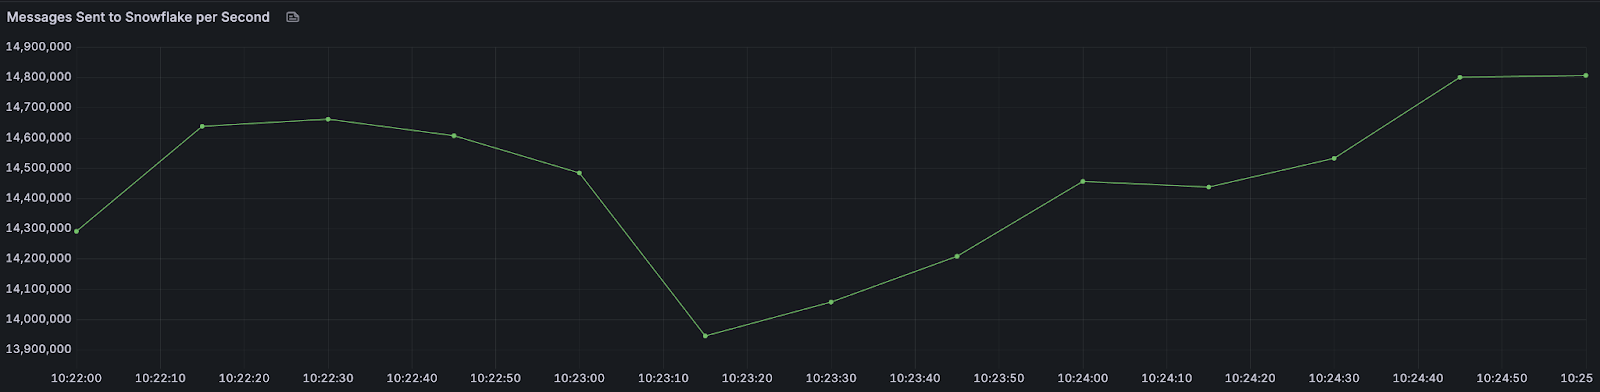
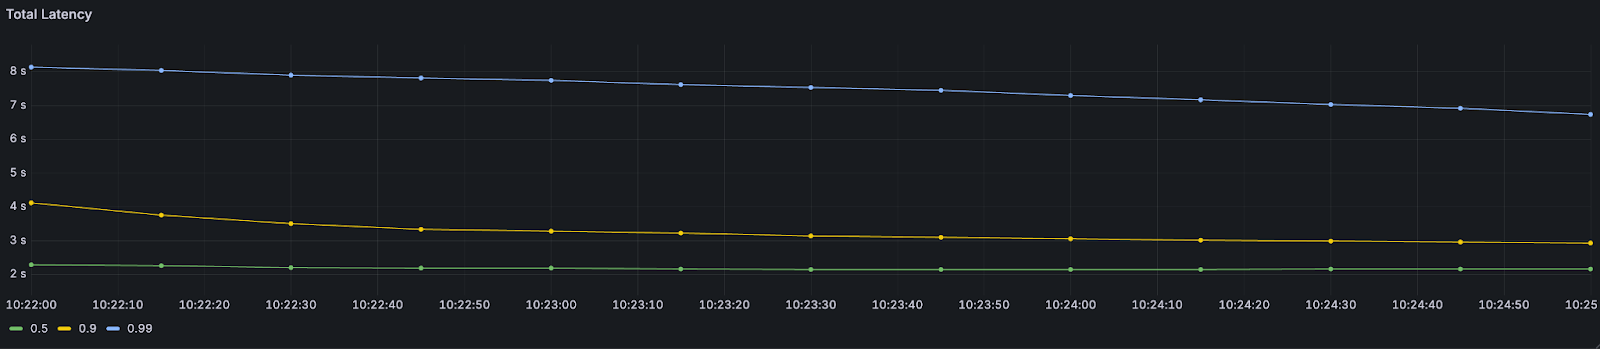
We observed the best balance — “the sweet spot” — between throughput and latency on a test which resulted in 14.5 GB/s with P50 latency of 2.18s and P99 of 7.49 seconds. All 3.8 billion messages landed as rows in the Snowflake table within six minutes total.
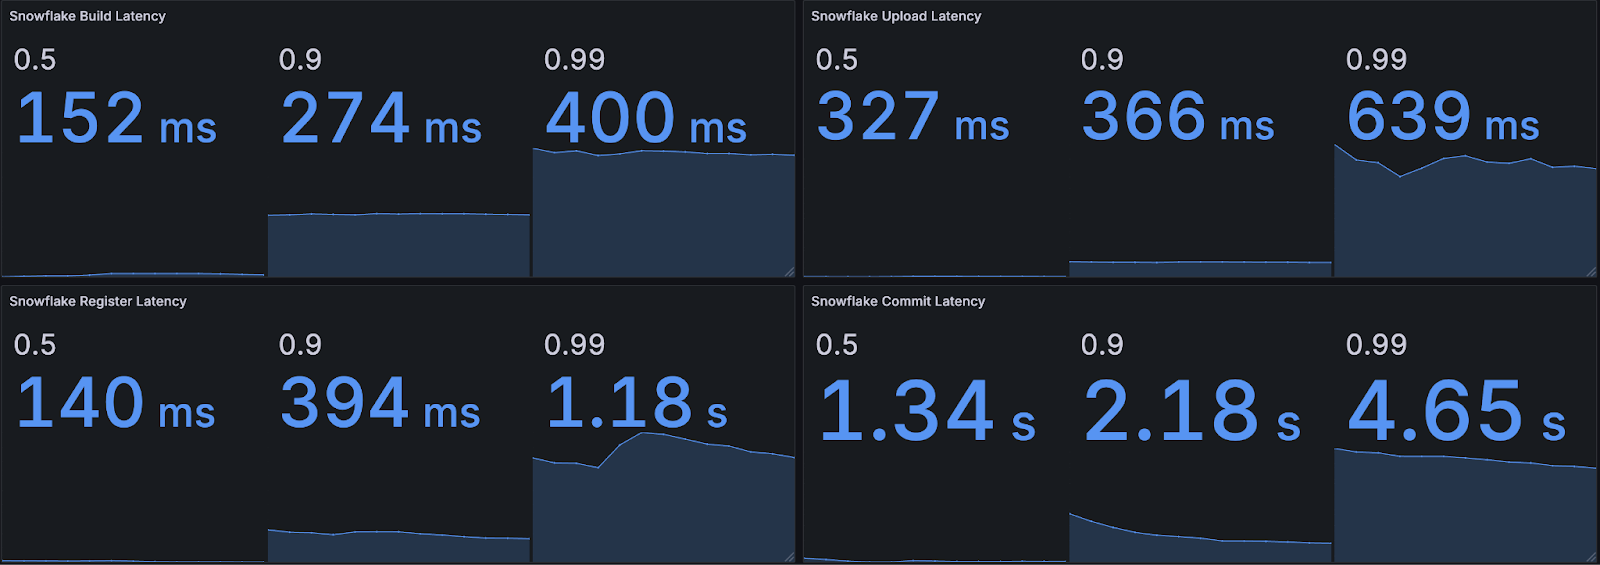
Of that 7.49-second P99 latency, 86% of it can be attributed to the Snowflake upload, register commit steps.
Note: Redpanda Connect and Snowflake were connected over the public internet; using AWS PrivateLink would reduce latency even further.
Here are a few shots of the winning test.
As promised, here are a few takeaways from our benchmark that might help you get the most out of your own data pipelines.
byte_size due to less calculation overhead.build_paralellism to a value close to the available instance cores, reserving some for other processes. For example, we had 48 core machines and set this to 40.channel_prefix with max_in_flight. Note that Snowflake supports a maximum of 10,000 channels per channel. (We had the Snowpipe API screaming at us on several tests.)Redpanda Connect and Snowflake Streaming can deliver impressive throughput while keeping P99 latencies under 8 seconds in the “sweet spot” configuration.
For data architects and engineering leaders, these results prove you can confidently use Redpanda to power real-time analytics and business intelligence pipelines — for market surveillance, fraud detection, or operational dashboards — so businesses can get insights in seconds, not hours.
Note that these benchmarks should serve as a guideline for building your own pipelines and tuning them to achieve your goals. The results can be extrapolated to better understand how to best size and configure for your use case.
If you have questions about this benchmark or any of the technologies we used, ask away in the Redpanda Community Slack.
47% lower latencies using 15% less CPU means better performance for intensive workloads

Benchmark shows Vera provides 5.5x lower latencies and up to 73% higher throughputs than other leading CPU models
Subscribe to our VIP (very important panda) mailing list to pounce on the latest blogs, surprise announcements, and community events!
Opt out anytime.
.png)