Full CDC semantics land in the Iceberg output for Redpanda Connect
Your lakehouse mirrors the database, instantly.

A guide on managing your data streaming pipelines “the GitOps way”


Redpanda Connect makes building streaming data pipelines as simple as writing YAML, giving engineers 300+ pre-built connectors to seamlessly move and transform data. As usage expands and the number of pipelines grows, organizations reach a point where they need to evolve from ad-hoc experimentation to a mature, operationalized platform.
That’s where GitOps comes in.
Managing applications on Kubernetes, running Redpanda Connect declaratively through Git, and having a tool like Argo CD continuously reconcile the desired state provides the foundation for strong security and auditability, faster and safer deployments, consistent and reproducible environments, and not to mention a vastly better developer experience.
In this blog, you’ll learn how to:
To follow along, fork the GitHub repository into your own account so you can customize the pipeline configurations and push updates that Argo CD will automatically deploy.
With that, let’s see how to operationalize Redpanda Connect—the GitOps way.
Before we dive in, let’s cover Redpanda Connect’s two deployment modes, each optimized for different operational models:
Standalone mode runs a single pipeline with configuration baked directly into the deployment. It’s simple, predictable, and ideal when pipelines need strong isolation or distinct scaling behavior.
Streams mode can host multiple pipelines within a single deployment. Pipelines are loaded dynamically from ConfigMaps and can be added, updated, or removed without redeploying pods. This makes it ideal for multi-tenant platforms, internal developer portals, or any environment with a high rate of pipeline churn.
Here’s a helpful comparison table:
TL;DR - Choose standalone mode for simplicity and isolation. Choose streams mode for flexibility and scale, especially in platform-style deployments.
Now, let’s try out both modes the GitOps way.
To keep it simple, forward the Argo CD server to a local port.
kubectl port-forward svc/argocd-server -n argocd 8080:443Set a new admin password.
argocd admin initial-password -n argocd
argocd login localhost:8080
argocd account update-password
Verify you can log in to the Argo CD server UI in your browser at https://localhost:8080. (You might be warned about an insecure connection when using self-signed certificates.)
Next, connect the Kubernetes cluster as an Argo CD destination. You can do this in the UI or with the CLI as follows:
kubectl config get-contexts #List your K8s contexts

argocd cluster add <context name>Here’s what we’re going to do:
Start by creating an Argo CD “Application”. This is a CRD that informs Argo CD of the desired state of the deployment.
In the example below, we’ve defined some metadata properties and the destination Kubernetes cluster and namespace. We’ve also told it to load the Redpanda Connect Helm chart from the official Redpanda repository and inject the custom pipeline values from our own project repository. This pattern decouples maintenance of the Helm chart from your application configuration.
# argocd-rpcn-standalone.yaml

apiVersion: argoproj.io/v1alpha1
kind: Application
metadata:
  name: redpanda-connect-standalone
  namespace: argocd        # where your Argo CD is installed
spec:
  project: default
  destination:
    server: <EKS controlplane endpoint>
    namespace: redpanda-connect       # target namespace for the release

  # Multiple sources: first is the Helm chart, second is the values repo
  sources:
    # 1) Helm chart source
    - repoURL: https://charts.redpanda.com
      chart: connect
      targetRevision: 3.1.0                 # chart version (or a semver range)
      helm:
        releaseName: redpanda-connect-standalone
        # valueFiles can reference other sources via their "ref" name
        valueFiles:
          - $values/standalone/standalone-mode.yaml

    # 2) Separate repo that holds your values files
    - repoURL: <your project repository>
      targetRevision: main
      ref: values

  syncPolicy:
    automated:
      prune: true
      selfHeal: true
Here, the values file is passed to the Helm chart, which includes how many replicas to deploy and the pipeline configuration. This example simply generates fake names, converts the text to uppercase, and outputs to both a Redpanda topic and stdout.
# standalone-mode.yaml

deployment:
  replicaCount: 1
envFrom:
  - secretRef:
      name: redpanda-password
config:
  input:
    label: "generate-names"
    generate:
      interval: 1s
      count: 0
      mapping: |
        # Store the generated names in variables
        let first_name = fake("first_name")
        let last_name = fake("last_name")
        # Build the message
        root.name = ($first_name + " " + $last_name)
  pipeline:
    processors:
      - label: "processor-uppercase-names"
        mapping: |
          root.name = this.name.uppercase()
  output:
    broker:
      pattern: fan_out
      outputs:
        - redpanda:
            seed_brokers: [ "<your-broker>" ]
            tls:
              enabled: true
            sasl:
              - mechanism: SCRAM-SHA-256
                username: <your username>
                password: ${RP_PASSWORD}
            topic: rpcn-standalone-topic
        - stdout: {}
Set up the Redpanda topic and user credentials. This example uses rpk, but you can use Redpanda Console or the Topic and User CRDs available in the Redpanda Kubernetes Operator if you’re operating Redpanda the GitOps way as well.
rpk topic create rpcn-standalone-topic

rpk security user create rpcn-user --mechanism scram-sha-256
# make note of the password

rpk security acl create --allow-principal User:rpcn-user --operation all --topic rpcn-standalone-topic --group rpcn-gitops-first-names --group rpcn-gitops-last-names
# This creates the ACL to allow the user perform all operations on the topic and the consumer groups we will use later on
Create the Kubernetes namespace and load rpcn-user’s password as a secret.
kubectl create namespace redpanda-connect
kubectl create secret generic redpanda-password \
--from-literal=RP_PASSWORD=<your-password> \
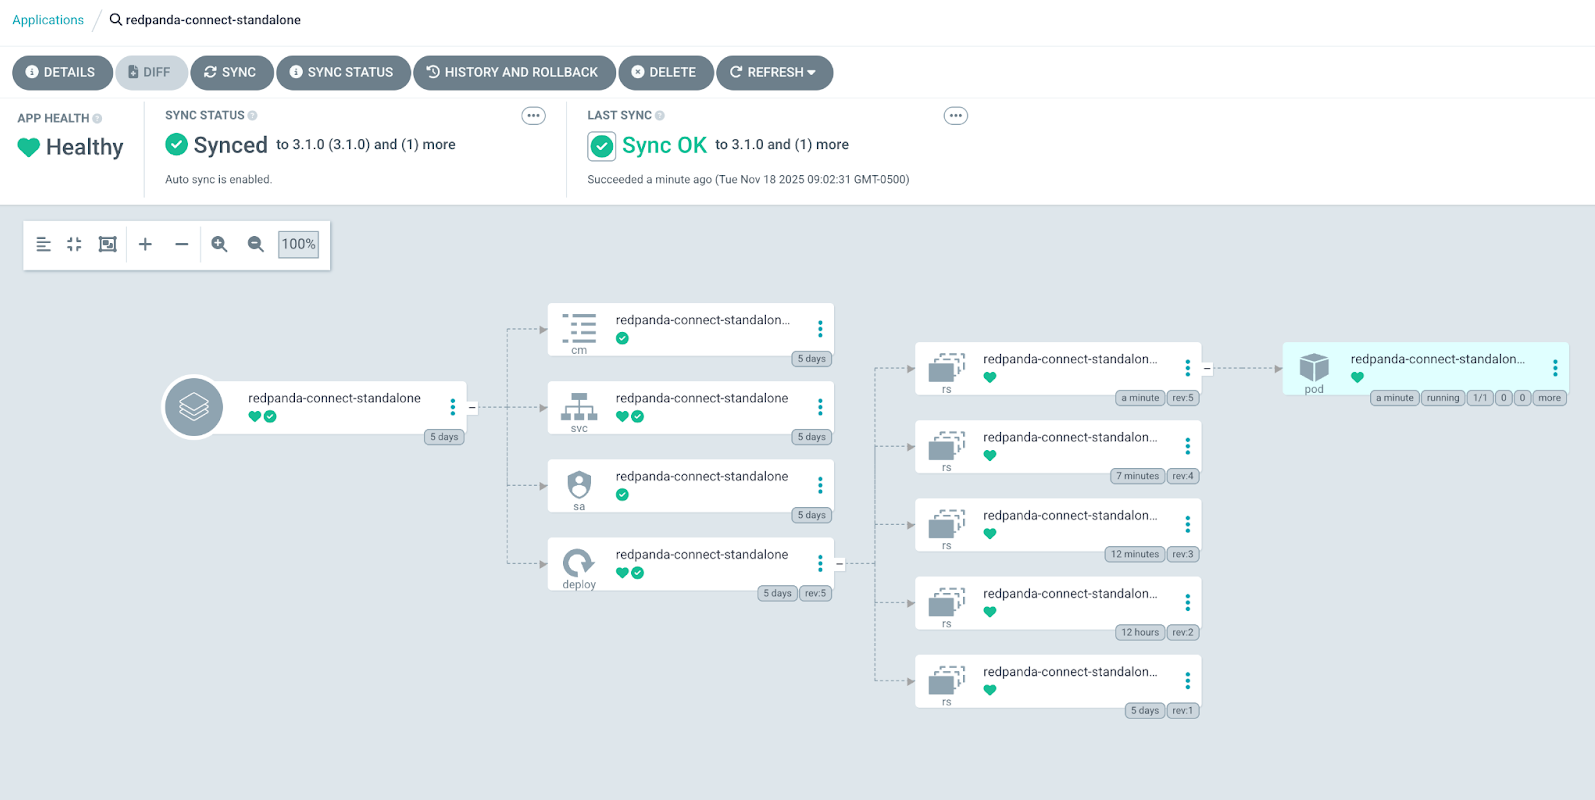
--namespace redpanda-connectApply the Argo CD application and observe the sync progress in the Argo CD UI.
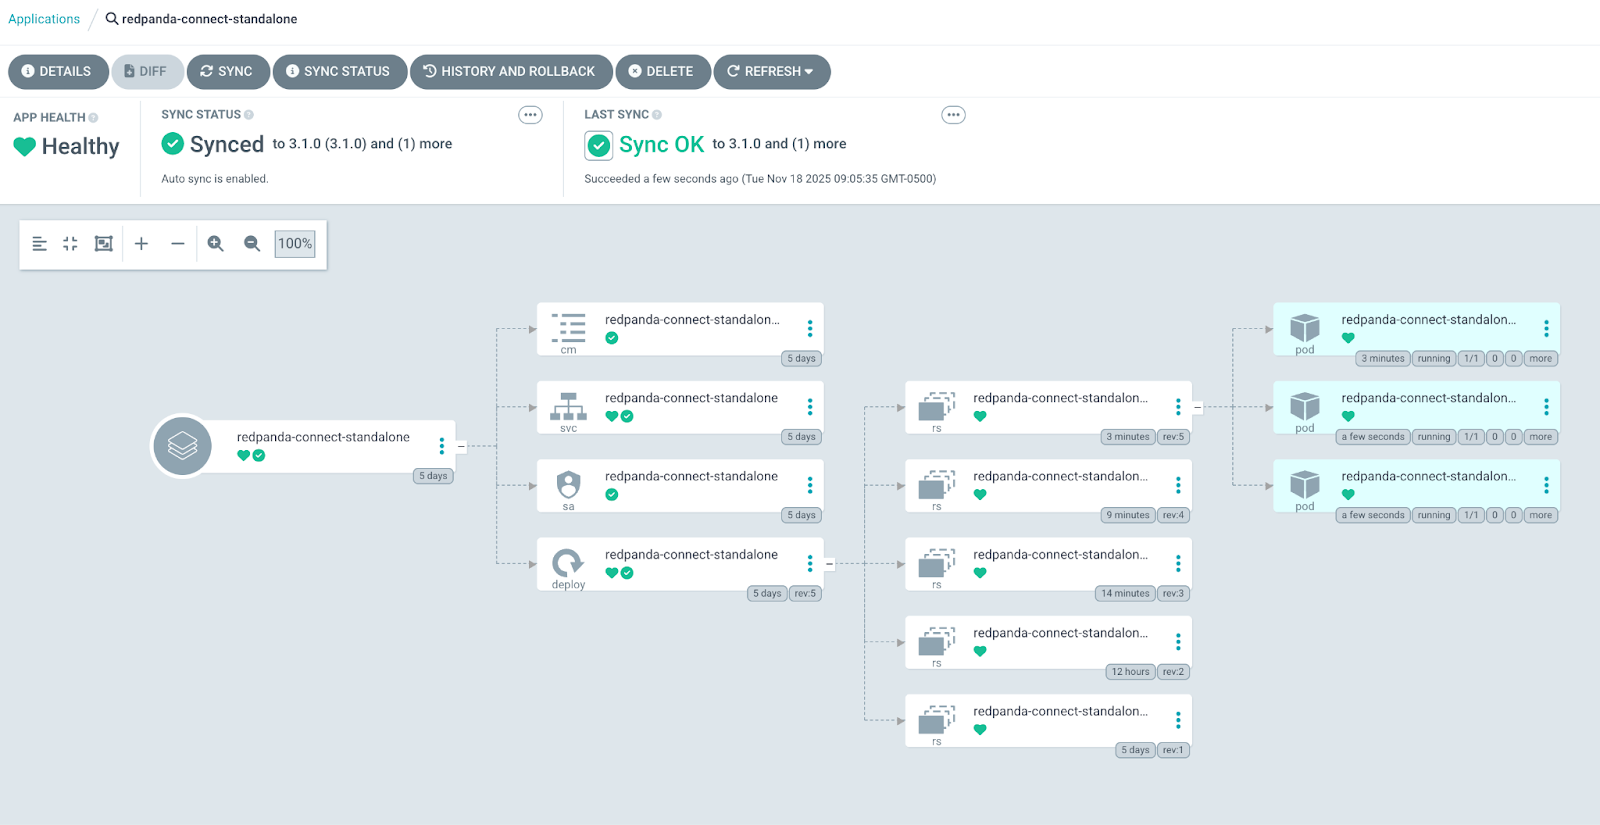
kubectl apply -f standalone/argocd-rpcn-standalone.yamlGo to the ArgoCD UI and view the application. It should show that the sync was successful and there’s one pod running.
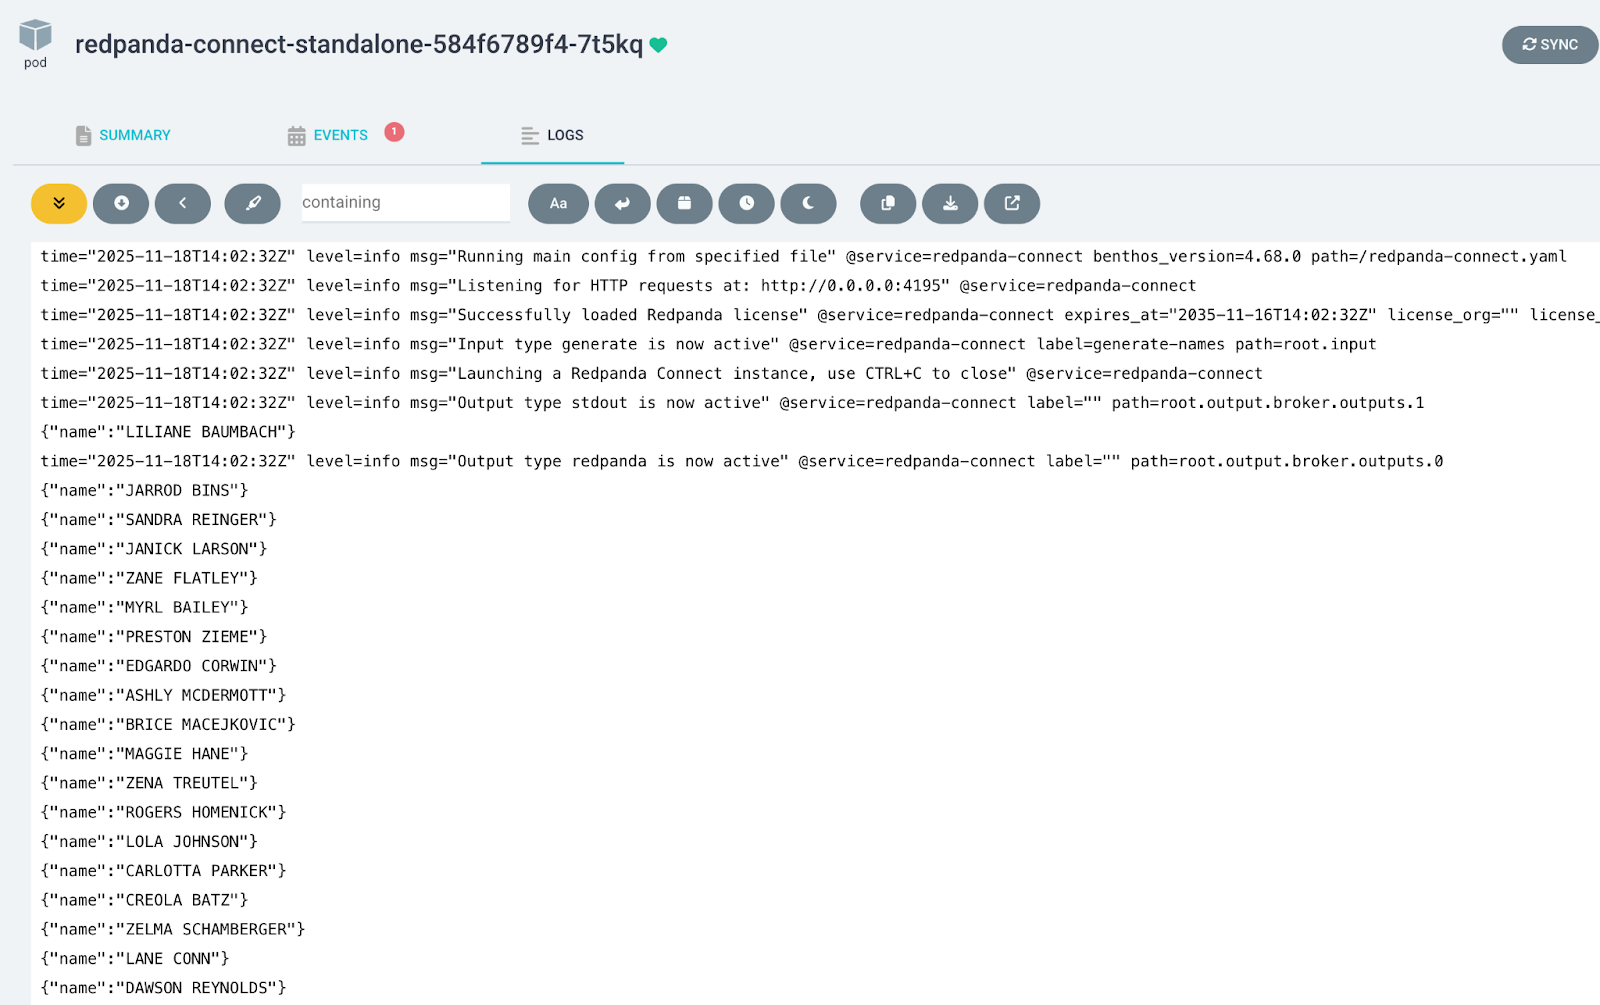
Click on the pod and select the Logs tab. You’ll see the stream of generated data.
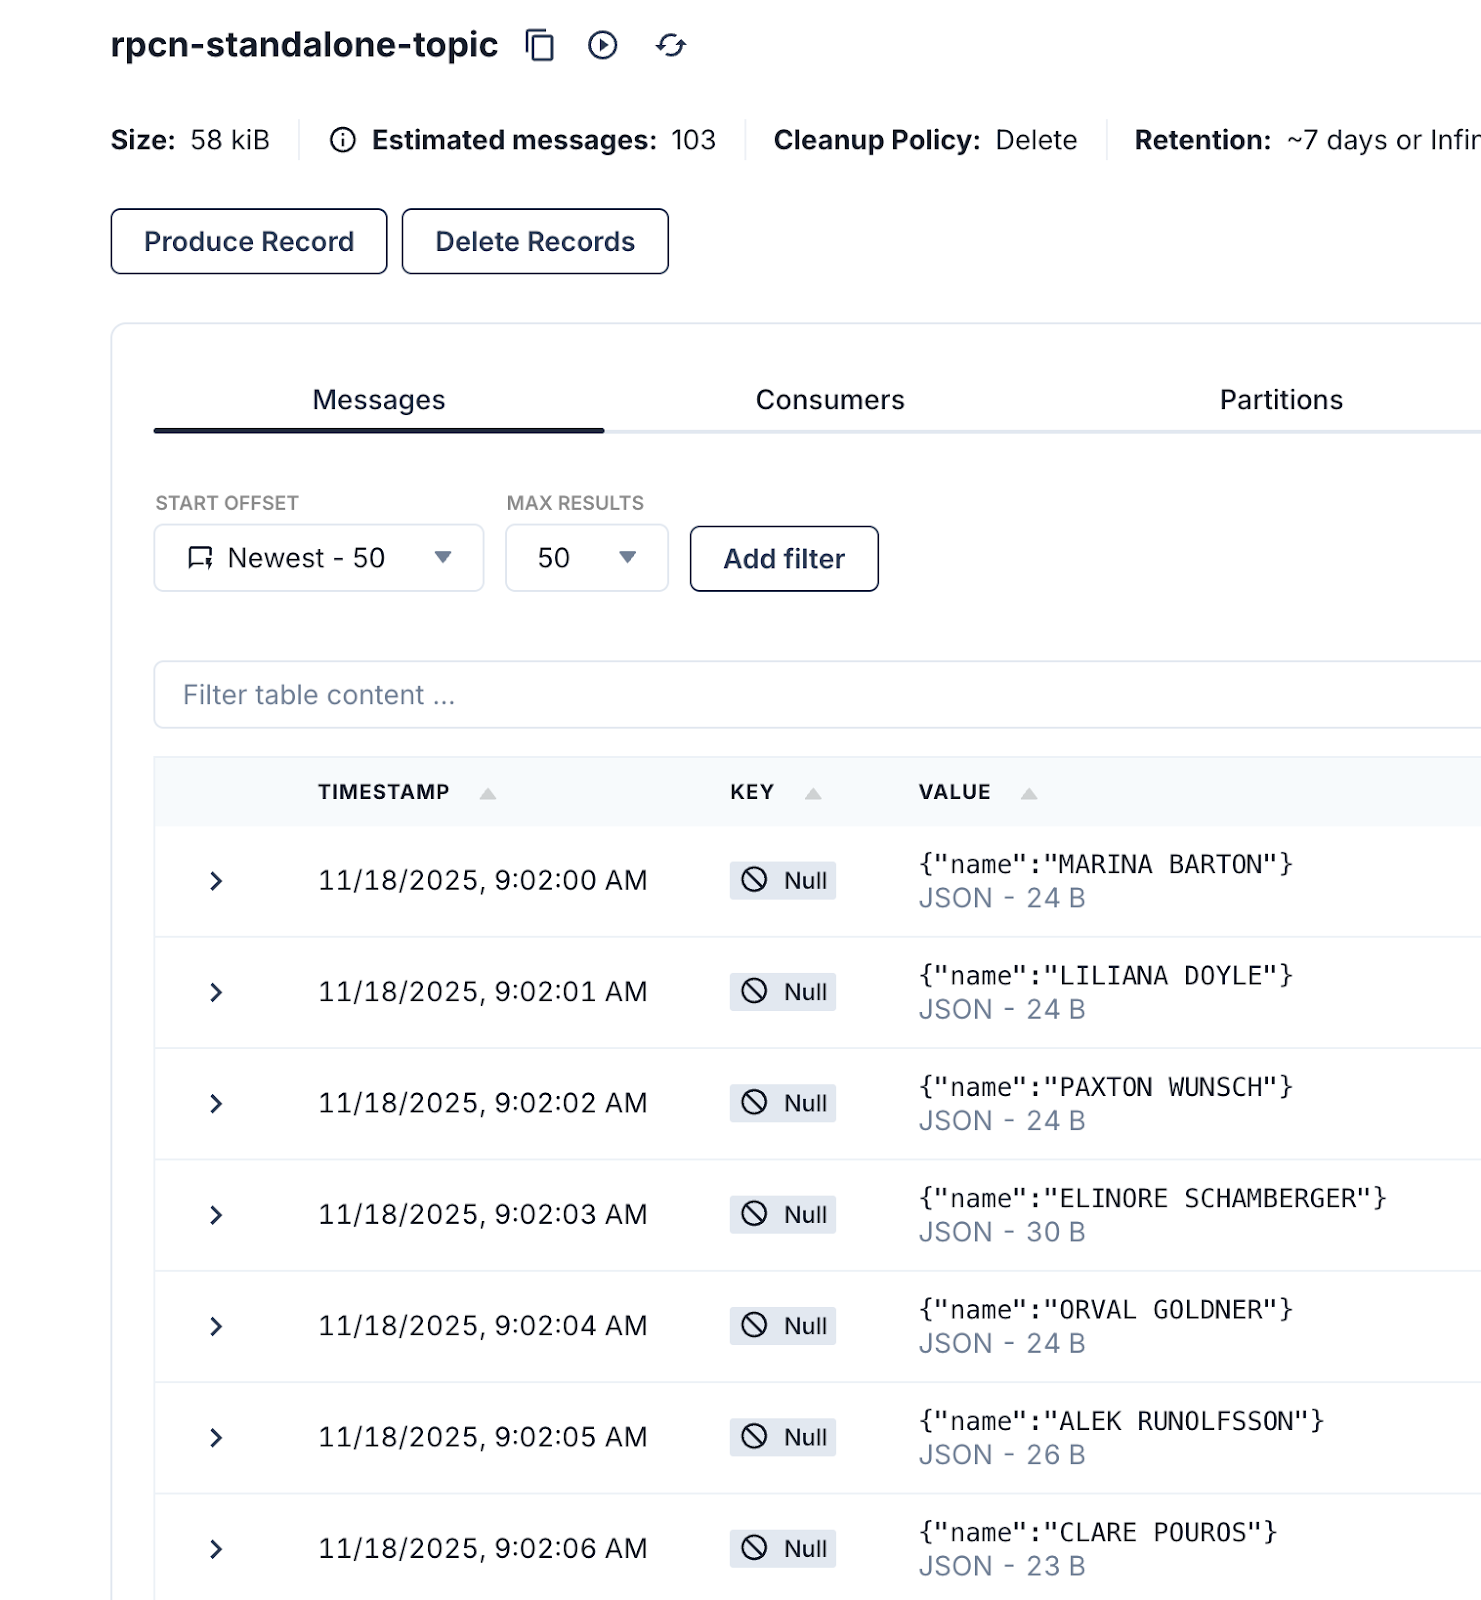
Go to Redpanda Console and view the topic to confirm the data is flowing.
Scaling in and out is as easy as changing the replica count. To give it a try, update deployment.replicaCount from 1 to 3.
# standalone-mode.yaml

deployment:
  replicaCount: 3
Commit and push the changes to the remote repository.
git commit -am “Scaling Up”
git push -u origin main
Wait for Argo CD to sync, or you can trigger a manual sync. You’ll see the change was automatically picked up and two additional pods were deployed.
Here’s what we’re going to do:
Streams mode loads pipeline definitions from ConfigMaps. We’ll use Kustomize to easily convert our pipeline files to ConfigMaps. Argo CD automatically decides the toolchain to use when deploying an application. The presence of kustomization.yaml tells ArgoCD to use Kustomize.
First, enable Argo CD to support building Helm charts with Kustomize.
# add/merge the build option
kubectl -n argocd patch configmap argocd-cm --type merge -p \
'{"data":{"kustomize.buildOptions":"--enable-helm --load-restrictor LoadRestrictionsNone"}}'

#Restart ArgoCD repo-server and controller
kubectl -n argocd rollout restart deploy/argocd-repo-server

kubectl -n argocd rollout restart deploy/argocd-application-controller 2>/dev/null || \
kubectl -n argocd rollout restart sts/argocd-application-controller
Here’s our Argo CD application:
# argocd-rpcn-streams.yaml

apiVersion: argoproj.io/v1alpha1
kind: Application
metadata:
  name: redpanda-connect-streams
  namespace: argocd
spec:
  project: default
  destination:
    server: <EKS controlplane endpoint>
    namespace: redpanda-connect
  source:
    repoURL: <your project repository>
    targetRevision: main
    path: streams

  syncPolicy:
    automated:
      prune: true
      selfHeal: true
We have two pipelines to run: first-names.yaml and last-names.yaml. Each consumes from the Redpanda topic we populated in the previous standalone mode pipeline. The names are then split into first and last, respectively, and sent to stdout.
Here’s a look at the Kustomize configuration:
# kustomization.yaml

apiVersion: kustomize.config.k8s.io/v1beta1
kind: Kustomization
namespace: redpanda-connect

# 1) Generate the ConfigMap with hash
configMapGenerator:
  - name: connect-streams
    files:
      - config/first-names.yaml
      - config/last-names.yaml
generatorOptions:
  disableNameSuffixHash: false

# 2) Inflate the Redpanda Connect Helm chart
helmCharts:
  - name: connect
    repo: https://charts.redpanda.com
    version: 3.1.0
    releaseName: redpanda-connect-streams
    namespace: redpanda-connect
    includeCRDs: true
    valuesFile: streams-mode.yaml
Finally, below is our Redpanda Connect configuration. Notice you can set global configuration such as Prometheus metrics, logger settings, and secrets.
# streams-mode.yaml

streams:
  enabled: true
  streamsConfigMap: "connect-streams"
deployment:
  replicaCount: 1
metrics:
  prometheus: {}
logger:
  level: INFO # Set logging level (e.g., INFO, DEBUG).
  static_fields:
    '@service': redpanda-connect-streams # Add static fields to logs for better traceability.
envFrom:
  - secretRef:
      name: redpanda-password
Next, deploy the Argo CD application.
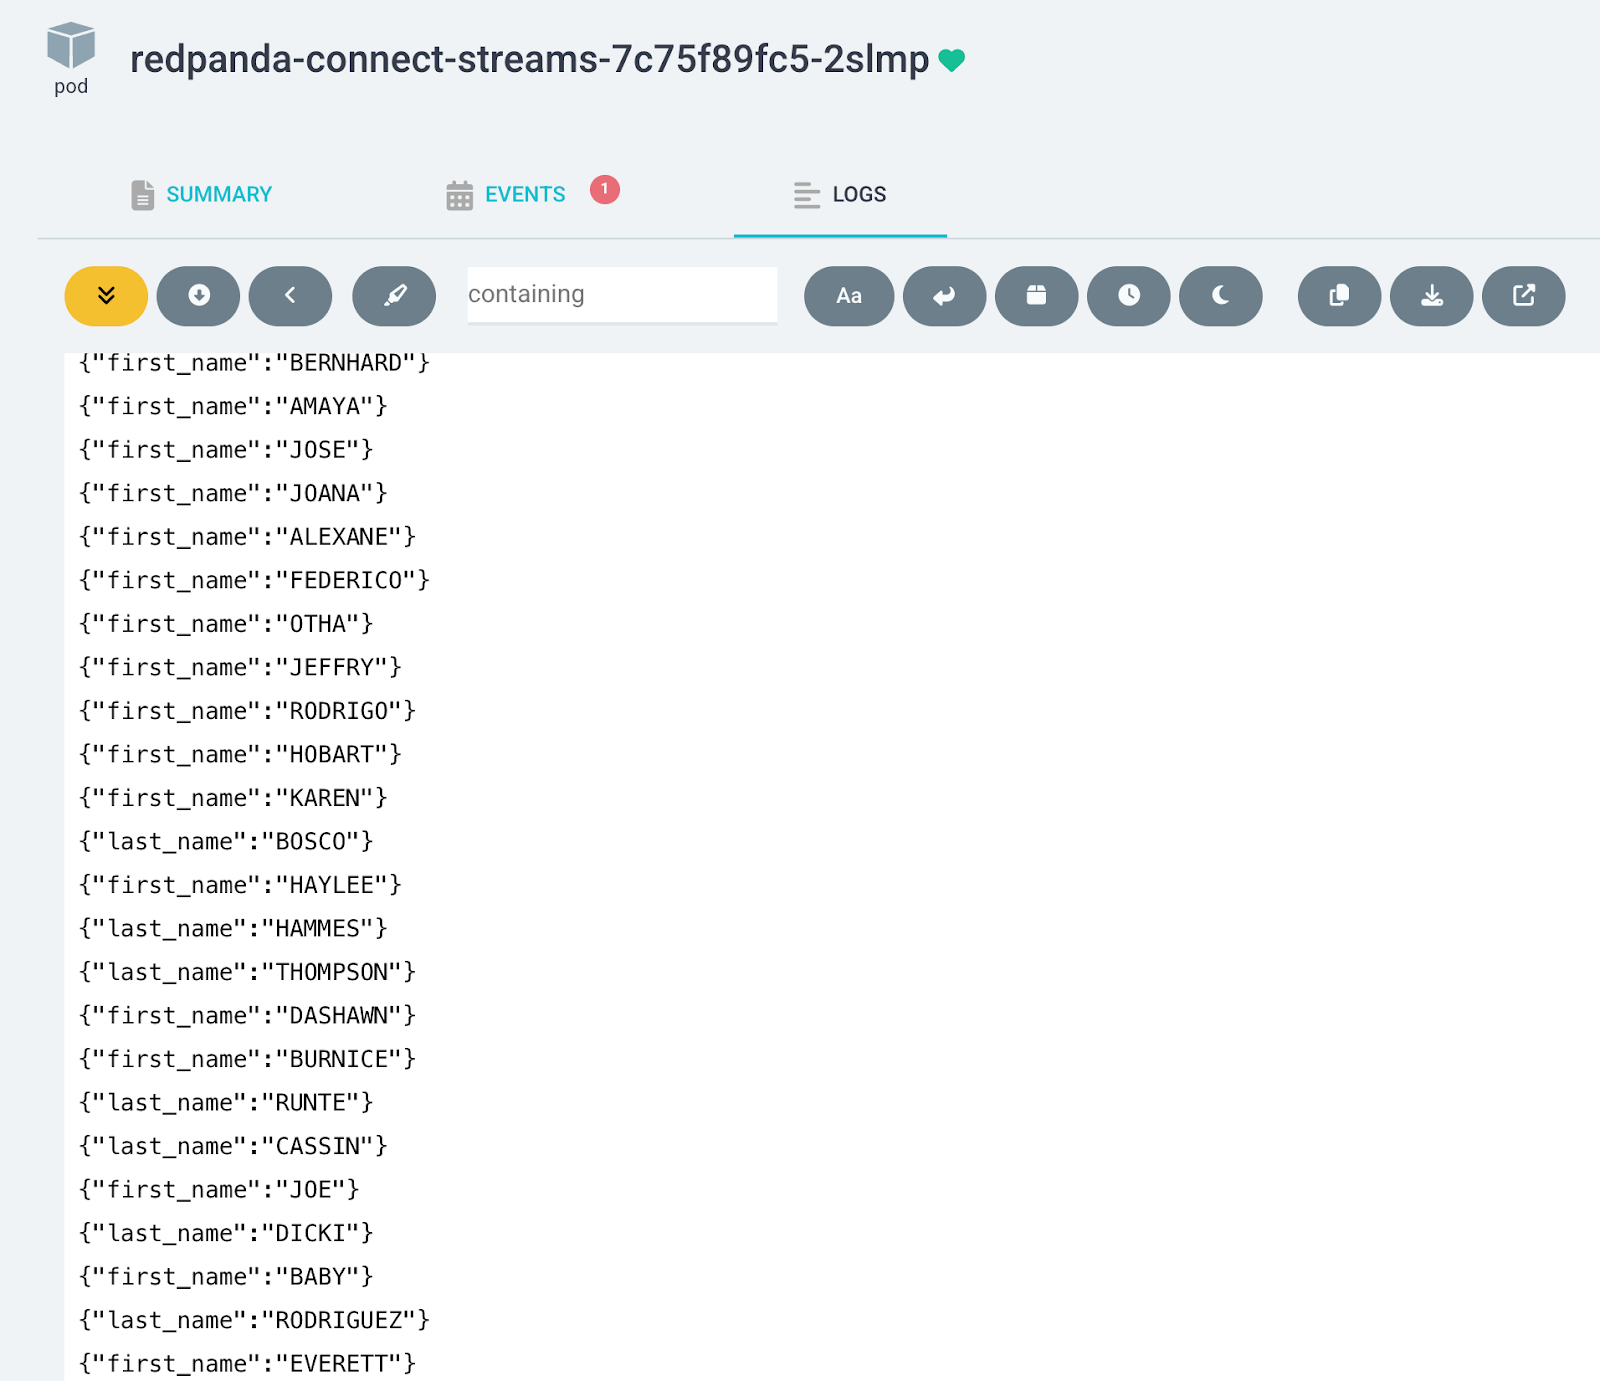
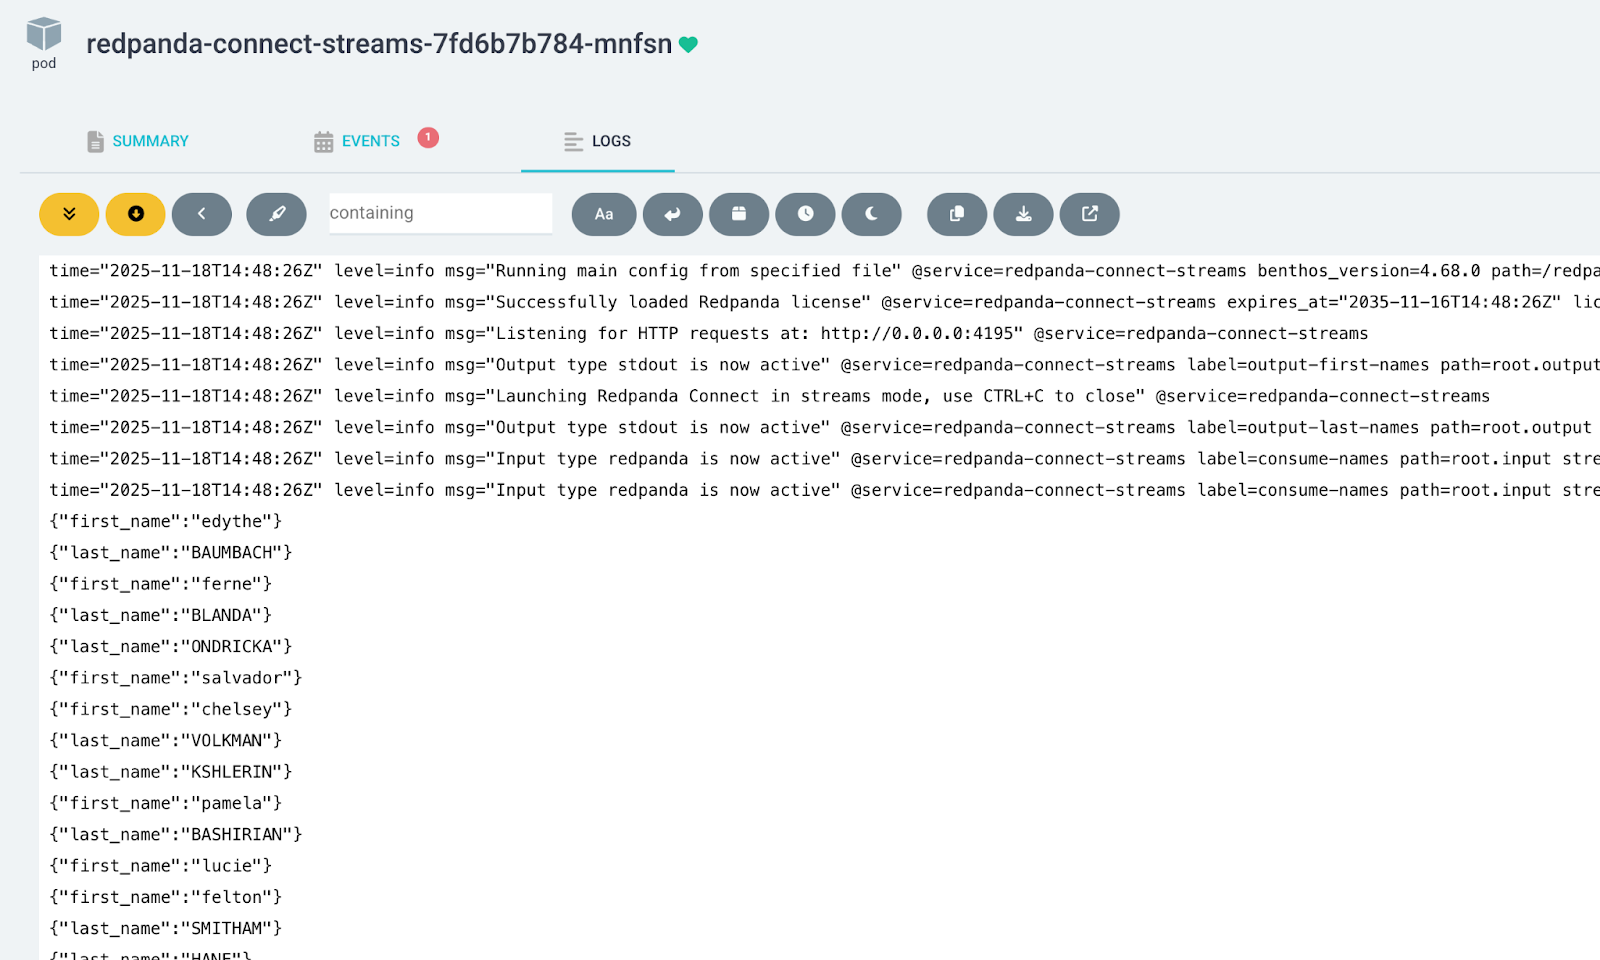
kubectl apply -f streams/argocd-rpcn-streams.yamlFrom the Argo CD UI, click on the pod to see the first-names and last-names pipelines logging output together.
Let’s modify the first-names pipeline to process the text to lowercase and watch our GitOps flow redeploy the pod.
# first-names.yaml

pipeline:
  processors:
    - mapping: |
        root.first_name = this.name.split(" ").index(0).lowercase()
Commit and push the change.
git commit -am “convert first names to lowercase”
git push -u origin main
Wait for Argo CD to sync or trigger a manual sync. You’ll see the new pod roll out, logging lowercase first names.
Et voilá! Kustomize and ArgoCD did the heavy lifting. Kustomize generated a new hashed ConfigMap name when the pipeline configuration changed and rewrote the Helm chart references so the deployment points to the new hash. ArgoCD then executed a rolling restart with graceful component shutdown to minimize the data loss.
When Redpanda Connect runs in Streams mode, it exposes an HTTP REST API to create, read, update, and delete pipelines at runtime.
This API is compatible with the GitOps philosophy as long as it’s used by automation that derives its desired state from Git. For example, a GitOps controller or CI/CD workflow can watch a repository of pipeline configs and apply them to Redpanda Connect through the API, just as Argo CD interacts with the Kubernetes API.
It becomes a GitOps anti-pattern only when humans or external systems modify pipelines through the API without updating Git. This creates “snowflake” pipelines that cannot be reconstructed from version control and breaks the fundamental GitOps guarantee: Git is the single source of truth.
Feel free to experiment with the API endpoints. Here are a few examples:
kubectl port-forward svc/redpanda-connect-streams 8081:80 -n redpanda-connect

curl http://localhost:8081/version
curl http://localhost:8081/ready
curl http://localhost:8081/streams
curl http://localhost:8081/metrics Once you have an automated fleet of Redpanda Connect pipelines running, the next critical question is: how do you know they’re healthy? You need visibility into metrics and logs to debug issues and optimize performance.
Redpanda Connect makes this especially straightforward by exposing Prometheus-compatible metrics natively. This means you can drop Redpanda Connect into any modern monitoring stack without custom exporters or sidecars.
One method to “GitOpsify” up a full observability suite is to deploy the kube-prometheus-stack with Argo CD. This stack bundles the following components for a rapid suite setup:
We can also layer in a Prometheus service monitor for Redpanda Connect and Redpanda Connect Grafana Dashboard to bootstrap real-time telemetry without manual intervention.
The entire observability layer is declarative, version-controlled, self-healing, and baked directly into your platform’s lifecycle. No manual dashboard configuration or ad-hoc commands required.
For details on the implementation, check out the examples in the GitHub repository.
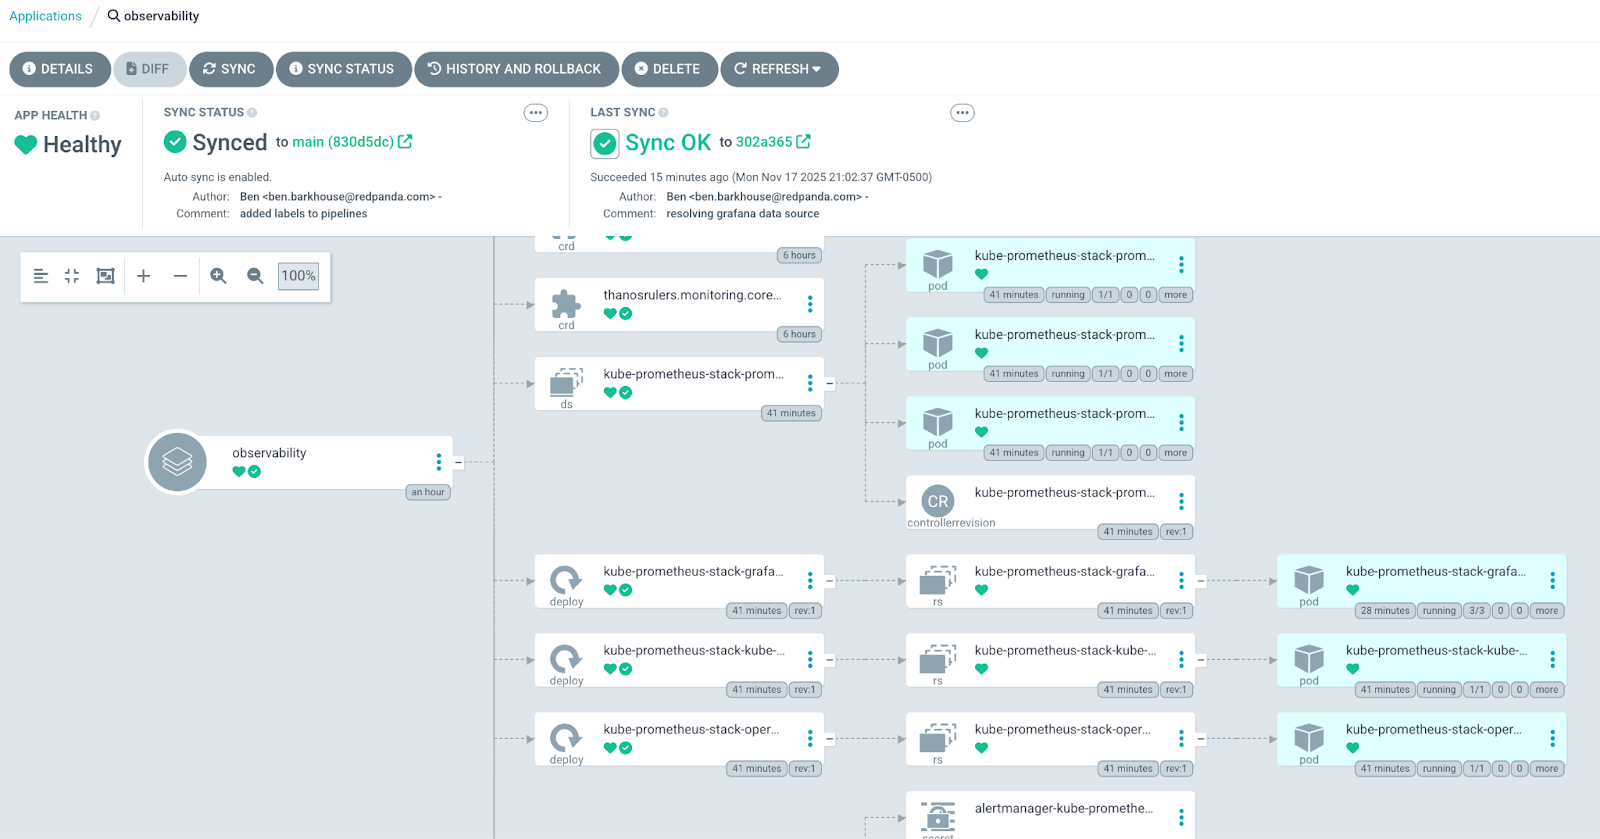
Here’s a glimpse of our observability Argo CD application:
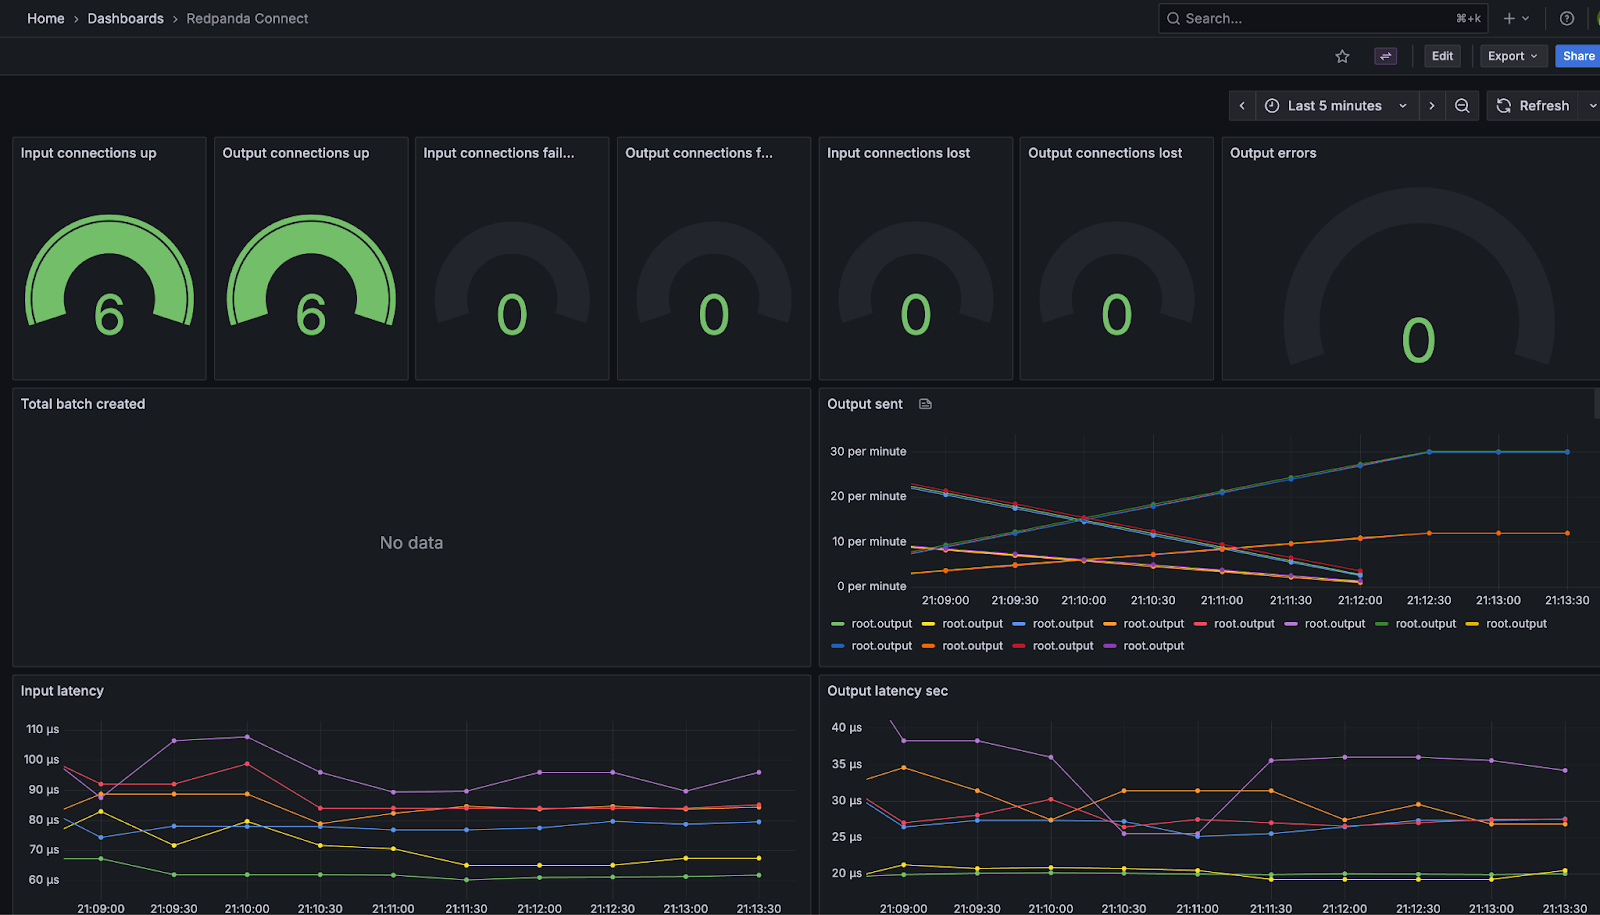
And, here’s the Redpanda Connect Grafana dashboard populated and ready to use:
If you want to keep the Argo CD applications, then simply scale the pipeline replicaCount to 0. Otherwise, you can delete the entire application in the UI or CLI.
argocd app delete redpanda-connect-streams
argocd app delete redpanda-connect-standaloneAt Redpanda, we want what every engineer wants: fewer manual ops, predictable deployments, and a standard workflow. By operationalizing Redpanda Connect with GitOps, you enable consistent, low-overhead data delivery across teams and environments with a single, predictable workflow. How neat is that?
What you learned in this post is a starting point for maturing Redpanda Connect in your organization from “just another tool” into a core data platform capability. So what’s next? Here are a few ideas to mull over as you build and evolve Redpanda Connect into a production-ready platform:
If you have questions or want to share how you’re using Redpanda Connect in your organization, drop us a note in the Redpanda Community on Slack.
Subscribe to our VIP (very important panda) mailing list to pounce on the latest blogs, surprise announcements, and community events!
Opt out anytime.