Introducing Oracle CDC in Redpanda Connect
Simplified CDC for real-time access without re-architecting
Learn how to do real-time anomaly detection using Redpanda and Bytewax with Timely Dataflow.
To run the demo end-to-end, you need to start the Redpanda container as well as the Python producer and consumer scripts. The Python containers will wait until Redpanda is ready to accept data. After that, you should see the producer pushing mock air quality data into the air-quality topic. The Bytewax consumer will start calculating the rolling average of the inputs and running the supervised anomaly detection algorithm. The output will be sent to the air-quality-anomalies topic.
You can set up Redpanda using the provided docker-compose.yml file. After starting a Redpanda instance, you can access a shell inside the container to use rpk, the official bundled CLI application for Redpanda clusters. This allows you to create topics with a simple command. If you can't access the cluster manually to create topics, you can automate their creation by interfacing with the Admin API of Redpanda from Python.
Anomaly detection in this application is performed using Bytewax and Redpanda. Bytewax reads from the Redpanda topic, calculates the anomalies, and produces the results to a different topic. For calculating the outliers, a five-second window is used to aggregate the data coming from the sensors. Using these averages, anomalies are detected and then pushed into a new Redpanda topic.
Bytewax is a Python native binding to the Rust-based Timely Dataflow library. It allows for the quick building of powerful applications in the same language as your mock producer. When integrated with Redpanda, it harnesses the power of the Rust-based Timely Dataflow framework, combined with the robustness and developer-friendliness of Redpanda, to build real-time data processing systems quickly.
Timely Dataflow is a low-latency cyclic dataflow computational model that enables the building of data-parallel systems scalable from a single thread on your laptop to a distributed execution environment across a cluster of computers. When integrated with Redpanda, an Apache KafkaⓇ API-compatible data store, it can be used to monitor data from multiple sources in real time.
Highly scalable distributed processing has been a traditionally difficult task for any team to achieve. However, with technologies like Timely Dataflow and Redpanda, today it is easier than ever to build real-time fault-tolerant and easy-to-scale systems.
Timely Dataflow is a low-latency cyclic dataflow computational model, meaning it allows you to build data-parallel systems that can be scaled up from one thread on your laptop to a distributed execution environment across a cluster of computers.
A great use-case for Timely Dataflow is to detect anomalies in real-time data. Redpanda — as an Apache KafkaⓇ API-compatible data store — enables us to easily create an application that can monitor data coming from multiple sources in real time.
Live anomaly detection usually requires a pre-trained model but for this project we opted for an online algorithm.
Bytewax is a Python native binding to the Rust-based Timely Dataflow library, which allows us to quickly build powerful applications in the same language as our mock producer.
Integrating Bytewax with Redpanda allows us to harness the power of the Rust-based Timely Dataflow framework which, combined with the robustness and developer-friendliness of Redpanda, allows us to build real-time data processing systems quickly.
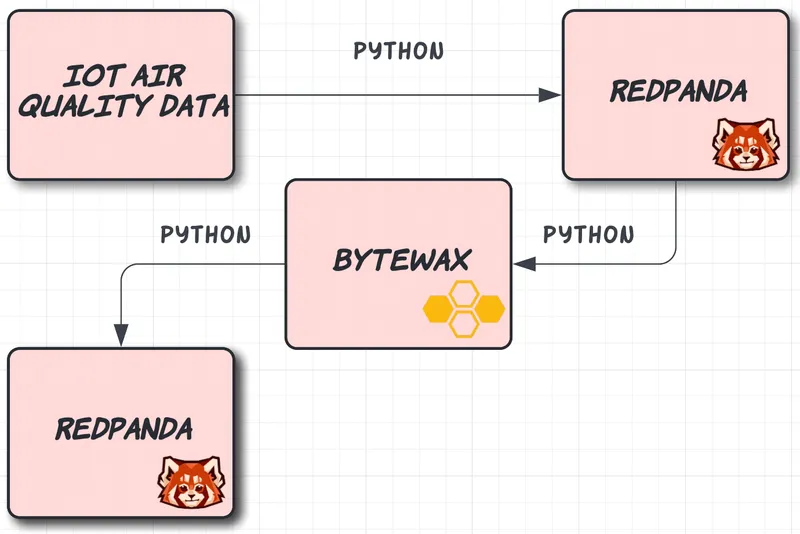
The main flow of the application can be described using the following diagram:

Bytewax reads from the Redpanda topic, calculates the anomalies and produces the results to a different topic. As mentioned above, there is no distinction between Bytewax and Timely Dataflow in the diagram because Bytewax is a wrapper around the Rust Timely Dataflow library.
For the sensor data, we use a mock data generator that generates random air quality values and pushes them into a topic in Redpanda.
For calculating the outliers, we will use a five-second window to aggregate the data coming from the sensors and using these averages we will detect anomalies, then push them into a new Redpanda topic. Alerting can be easily set up using the anomaly topic (watch out for a later post on this).
You can access the code used in this demo in this GitHub repo.
To build our real-time monitoring applications we will use Redpanda for storage and Bytewax for the anomaly detection.
Redpanda is a source-available, Kafka API-compatible data store. This API compatibility allows us to very quickly use it in place of Kafka. In our case, our Producer and Consumer side code can stay exactly the same as if they were targeting Kafka!
Bytewax is an up-and-coming data processing framework that is built on top of Timely Dataflow, which is a cyclic dataflow computational model. At a high-level, dataflow programming is a programming paradigm where program execution is conceptualized as data flowing through a series of operator based steps. The Timely Dataflow library is written in Rust which makes it blazingly fast and easy to use due to the language's great Python bindings.
To make setting up Redpanda for this project super easy, we can use the provided docker-compose.yml file. In this file we define a Redpanda service as such:
redpanda:
  image: docker.vectorized.io/vectorized/redpanda:v22.1.4
  container_name: redpanda
  command:
    - redpanda start
    - --overprovisioned
    - --smp 1
    - --memory 1G
    - --reserve-memory 0M
    - --node-id 0
    - --check=false
    - --kafka-addr 0.0.0.0:9092
    - --advertise-kafka-addr redpanda:9092
    - --pandaproxy-addr 0.0.0.0:8082
    - --advertise-pandaproxy-addr redpanda:8082
    - --set redpanda.enable_transactions=true
    - --set redpanda.enable_idempotence=true
    - --set redpanda.auto_create_topics_enabled=true
This will start a Redpanda instance which we can access on port 9092. Let's create this service first using docker-compose up -d redpanda. This will start the container in the background.
After the container is started we can run docker exec -it redpanda /bin/bash to access a shell inside the container, which allows us to use rpk, the official bundled CLI application for Redpanda clusters.
The CLI allows us to create topics with a simple command, so let's create two. One will store the data coming from our mock sensors, and one will store the calculated anomalies.
rpk create topic --topic air-quality --brokers 127.0.0.1.9092
rpk create topic --topic air-quality-anomalies --brokers 127.0.0.1.9092
To verify, we can list the topics with rpk topic list --brokers 127.0.0.1:9092.
In an environment where are unable to access the cluster manually in order to create topics, we can automate the their creation by interfacing with the Admin API of Redpanda from Python.
admin_client = KafkaAdminClient(
    bootstrap_servers=BOOTSTRAP_SERVERS, client_id="air-quality-producer"
)
topics = ["air-quality", "air-quality-anomalies"]
# Check if topics already exist first
existing_topics = admin_client.list_topics()
for topic in topics:
    if topic not in existing_topics:
        admin_client.create_topics(
            [NewTopic(topic, num_partitions=1, replication_factor=1)]
)The script we will use to generate the data is located under the path producer/main.py. The Kafka producers' configuration looks like this:
producer = KafkaProducer(bootstrap_servers="127.0.0.1:9092")The script will start five asynchronous workers that generate data every 3 seconds (configurable, but an easily interpretable time limit helps with the demo here) with the following minimal schema:
{
  "timestamp": "2022-07-15 11:34:32.1134000",
  "value": 23
}
All five workers are going to produce records to the same topic so in order to be able to identify which sensor was the source of our data we have to attach a key to the records being produced into Redpanda. This is done by adding a key argument to the producer.send function call:
producer.send(
    "air-quality",
    key=sensor_name.encode("utf-8"),
    value=json.dumps(data).encode("utf-8"),
)
If we want to test the application outside of Docker we can run the producer with the python producer/main.py command.
After a few seconds data should be flowing into Redpanda. The output of the script will look something like this:\
Sent data to Redpanda: {'timestamp': '2022-07-18 16:20:06.799306', 'value': 95}, sleeping for 3 seconds
Sent data to Redpanda: {'timestamp': '2022-07-18 16:20:06.910629', 'value': 98}, sleeping for 3 seconds
Sent data to Redpanda: {'timestamp': '2022-07-18 16:20:07.020454', 'value': 49}, sleeping for 3 seconds
Sent data to Redpanda: {'timestamp': '2022-07-18 16:20:07.127894', 'value': 59}, sleeping for 3 seconds
Sent data to Redpanda: {'timestamp': '2022-07-18 16:20:07.243341', 'value': 81}, sleeping for 3 seconds
Sent data to Redpanda: {'timestamp': '2022-07-18 16:20:11.812876', 'value': 13}, sleeping for 3 seconds
Sent data to Redpanda: {'timestamp': '2022-07-18 16:20:11.913514', 'value': 15}, sleeping for 3 seconds
Sent data to Redpanda: {'timestamp': '2022-07-18 16:20:12.023514', 'value': 43}, sleeping for 3 seconds
Sent data to Redpanda: {'timestamp': '2022-07-18 16:20:12.132398', 'value': 39}, sleeping for 3 seconds
Sent data to Redpanda: {'timestamp': '2022-07-18 16:20:12.247009', 'value': 38}, sleeping for 3 seconds
To validate if the data is arriving in Redpanda, we can inspect the topic using the rpk command, from inside the container.
docker exec -it redpanda /bin/bash
rpk topic consume air-quality --brokers 127.0.0.1:9092
This will show us all the records in the topic so far.
{
  "topic": "air-quality",
  "key": "Sensor3",
  "value": "{\"timestamp\": \"2022-07-18 16:20:17.024915\", \"value\": 4}",
  "timestamp": 1658154017025,
  "partition": 0,
  "offset": 257
}
{
  "topic": "air-quality",
  "key": "Sensor4",
  "value": "{\"timestamp\": \"2022-07-18 16:20:17.133643\", \"value\": 21}",
  "timestamp": 1658154017133,
  "partition": 0,
  "offset": 258
}
This fake data producer application is also part of the docker-compose.yml configuration file, so when you start all containers at once you won't have to manually initiate the script. In the entrypoint.sh script we poll Redpanda through it's exposed admin API and if it replies with a ready the producer app will start generating data.
while [[ "$(curl -s localhost:9644/v1/status/ready)" != "{\"status\":\"ready\"}" ]]; do sleep 5; done
python /app/main.pyLet's do some machine learning using our data from the Redpanda topic with Bytewax!
The code located in consumer/main.py is the consumer side code that will consume the data from the Redpanda topic, run the aggregation on a five-second window, calculate the anomalies suing a supervised learning algorithm and push them into the Redpanda anomaly topic.
The Consumer configuration looks like this:
consumer = KafkaConsumer(
    "air-quality",
    bootstrap_servers="127.0.0.1:9092",
    auto_offset_reset="earliest",
)
The auto_offset_reset="earliest" option will make the consumer start from the beginning of the topic. With some Bytewax helper functions we sort our incoming data and group it into five-second windows before return them as a generator.
 # Ensure inputs are sorted by timestamp
sorted_inputs = sorted_window(
    get_records(), datetime.timedelta(seconds=5), lambda x: x["timestamp"]
)
# All inputs within a tumbling window are part of the same epoch.
tumbling_window = tumbling_epoch(
    sorted_inputs, datetime.timedelta(seconds=5), lambda x: x["timestamp"]
)
The high-level flow of the timely dataflow pipeline looks like this in Python:
# Create a dataflow
flow = Dataflow()
# Group by sensor name
flow.map(group_by_sensor)
# Calculate the rolling average of Air Quality values
flow.map(calculate_avg)
# Calculate anomaly score in tumbling window of 5 seconds
flow.stateful_map(
    step_id="anomaly_detector",
    builder=lambda key: AnomalyDetector(n_trees=5, height=3, window_size=5, seed=42),
    mapper=AnomalyDetector.update,
)
# Annotate with anomaly
flow.map(annotate_with_anomaly)
# Send to anomaly Redpanda
flow.capture()
First, we instantiate a Dataflow object, then we sequentially apply the following transformations:
The Producer object is configured like this:
producer = KafkaProducer(
    value_serializer=lambda m: json.dumps(m).encode("utf-8"),
    bootstrap_servers="127.0.0.1:9092",
)
The actual anaomly detection is done in the AnomalyDetector class.
class AnomalyDetector(anomaly.HalfSpaceTrees):
    def update(self, data):
        normalized_value = float(data["aiq_avg"][0]) / 100
        self.learn_one({"value": normalized_value})
        data["score"] = self.score_one({"value": normalized_value})
        return self, data
Half-space trees are an online variant of isolation forests. Before feeding the data to the anomaly detector, we normalize them to the range [0, 1], as the algorithm expects values in this range.
Running the script with python consumer/main.py should print some logs that look like this:
Sending anomalous data to Redpanda: {'sensor_name': ['Sensor3'], 'timestamp': '2022-07-14 19:16:17.583034', 'aiq_avg': [94.0], 'score': 0.7786666666666666, 'anomaly': True} with key b'Sensor3'
Sending anomalous data to Redpanda: {'sensor_name': ['Sensor5'], 'timestamp': '2022-07-14 19:16:17.807478', 'aiq_avg': [6.0], 'score': 0.7253333333333334, 'anomaly': True} with key b'Sensor5'
Sending anomalous data to Redpanda: {'sensor_name': ['Sensor1'], 'timestamp': '2022-07-14 19:16:22.370494', 'aiq_avg': [91.0], 'score': 0.7413333333333334, 'anomaly': True} with key b'Sensor1'
Sending anomalous data to Redpanda: {'sensor_name': ['Sensor2'], 'timestamp': '2022-07-14 19:16:22.476654', 'aiq_avg': [53.0], 'score': 0.7573333333333333, 'anomaly': True} with key b'Sensor2'
Sending anomalous data to Redpanda: {'sensor_name': ['Sensor4'], 'timestamp': '2022-07-14 19:16:22.697965', 'aiq_avg': [96.0], 'score': 0.8213333333333334, 'anomaly': True} with key b'Sensor4'
After a few calculations we can check the target Redpanda topic to see if the data is arriving correctly.
docker exec -it redpanda /bin/bash

rpk topic consume air-quality-anomaly --brokers 127.0.0.1:9092
The records in this topic should look like this:
{
  "topic": "air-quality-anomalies",
  "key": "Sensor1",
  "value": "\"{\\\"sensor_name\\\": [\\\"Sensor1\\\"], \\\"timestamp\\\": \\\"2022-07-18 16:20:06.799306\\\", \\\"aiq_avg\\\": [95.0], \\\"score\\\": 0.8693333333333333, \\\"anomaly\\\": true}\"",
  "timestamp": 1658154557943,
  "partition": 0,
  "offset": 282
}
{
  "topic": "air-quality-anomalies",
  "key": "Sensor2",
  "value": "\"{\\\"sensor_name\\\": [\\\"Sensor2\\\"], \\\"timestamp\\\": \\\"2022-07-18 16:20:11.913514\\\", \\\"aiq_avg\\\": [15.0], \\\"score\\\": 0.9226666666666666, \\\"anomaly\\\": true}\"",
  "timestamp": 1658154557944,
  "partition": 0,
  "offset": 283
}
What this data means is that, in the five seconds following a certain timestamp, the average air quality value for that sensor was considered anomalous compared to all the previous rolling averages.
In order to run the demo end-to-end all you have to do is to run the following command:
docker-compose upThis will start our Redpanda container as well as our Python producer and consumer scripts. The Python containers will wait until Redpanda is ready to accept data and after that you should see the producer pushing mock air quality data into the air-quality topic. The Bytewax consumer will also get to work and start calculating the rolling average of the inputs and running the supervised anomaly detection algorithm. The output will be sent to the air-quality-anomalies topic.
If you want to see the logs of the containers, you can use the docker-compose logs command.
Successfully started services will log their output like this:
redpanda  | INFO  2022-08-03 08:51:28,298 [shard 0] redpanda::main - application.cc:1021 - Successfully started Redpanda!
consumer  | ++ curl -s redpanda:9644/v1/status/ready
producer  | ++ curl -s redpanda:9644/v1/status/ready
The producer will start logging the data it sends to Redpanda.
producer  | Sent data to Redpanda: {'timestamp': '2022-08-03 08:51:32.740664', 'value': 14}, sleeping for 3 seconds
producer  | Sent data to Redpanda: {'timestamp': '2022-08-03 08:51:32.844237', 'value': 16}, sleeping for 3 seconds
producer  | Sent data to Redpanda: {'timestamp': '2022-08-03 08:51:32.947056', 'value': 83}, sleeping for 3 seconds
producer  | Sent data to Redpanda: {'timestamp': '2022-08-03 08:51:33.050752', 'value': 76}, sleeping for 3 seconds
And after a few seconds (when we have enough data for our rolling average window parameter) we should see the following:
consumer  | Sending anomalous data to Redpanda: {'sensor_name': ['Sensor4'], 'timestamp': '2022-08-03 08:51:53.065961', 'aiq_avg': [18.0], 'score': 0.72, 'anomaly': True} with key b'Sensor4'
consumer  | Sending anomalous data to Redpanda: {'sensor_name': ['Sensor2'], 'timestamp': '2022-08-03 08:51:57.855306', 'aiq_avg': [62.0], 'score': 0.7573333333333333, 'anomaly': True} with key b'Sensor2'
consumer  | Sending anomalous data to Redpanda: {'sensor_name': ['Sensor3'], 'timestamp': '2022-08-03 08:51:57.961218', 'aiq_avg': [20.0], 'score': 0.752, 'anomaly': True} with key b'Sensor3'
consumer  | Sending anomalous data to Redpanda: {'sensor_name': ['Sensor1'], 'timestamp': '2022-08-03 08:52:02.782120', 'aiq_avg': [5.0], 'score': 0.7893333333333333, 'anomaly': True} with key b'Sensor1'
consumer | Sending anomalous data to Redpanda: {'sensor_name': ['Sensor2'], 'timestamp': '2022-08-03 08:52:02.860648', 'aiq_avg': [66.0], 'score': 0.736, 'anomaly': True} with key b'Sensor2'As you can see, creating a minimal, real-time, highly-scalable data processing pipeline is a breeze with Redpanda and Bytewax.
Redpanda's Kafka-compatibility allows us to integrate any tool that was built with Kafka in mind, like Bytewax. This combination of a fault-tolerant streaming data platform and a high-performance data processing framework is a powerful tool not just for hobby projects, but also for large-scale production systems.
Now that you know how to use these tools together, you can apply this knowledge to any number of applications you dream up in the future.
To learn more about Redpanda, check out the documentation here or join the Redpanda Community on Slack.

Simplified CDC for real-time access without re-architecting

A workshop on building and debugging real-world streaming pipelines

One architecture for real-time and analytics workloads. Easy to access, governed, and immediately queryable
Subscribe to our VIP (very important panda) mailing list to pounce on the latest blogs, surprise announcements, and community events!
Opt out anytime.