Drag, drop, done: a visual composer for Redpanda Connect
Boxes and arrows for people who move billions of events a day. No per-row invoice required.
.png)
Use Redpanda’s hyper-efficient Snowflake connector for real-time ad analysis


Organizations often track real-time ad impressions and clicks to measure the success of their ad campaigns. For the unfamiliar, ad impressions indicate how often a particular ad was shown to users, and clicks indicate how many times users clicked the ad. During flash sales, festive seasons, or mega-events, these parameters help organizations pull real-time analytics to optimize their ad campaign performance.
Now with machine learning and AI, you can use these real-time analytics for even sharper advertising strategies, like personalized product recommendations or buying pattern-based product cross-selling, to attract customers and maximize profit.
It’s a handy skill to have. So in this tutorial, you’ll learn how to perform real-time ad campaign analytics using impressions and click data using Redpanda’s Snowflake connector — a no-code configuration-driven approach to stream data from anywhere into Snowflake using Snowpipe Streaming (at 2X higher throughput than Kafka Connect).
Imagine you’re working for a tech gadget manufacturer running digital ad campaigns that want real-time analytics to track engagement metrics like impressions, clicks, and click-through rate (CTR). CTR measures how often users click an ad, reflecting its effectiveness.
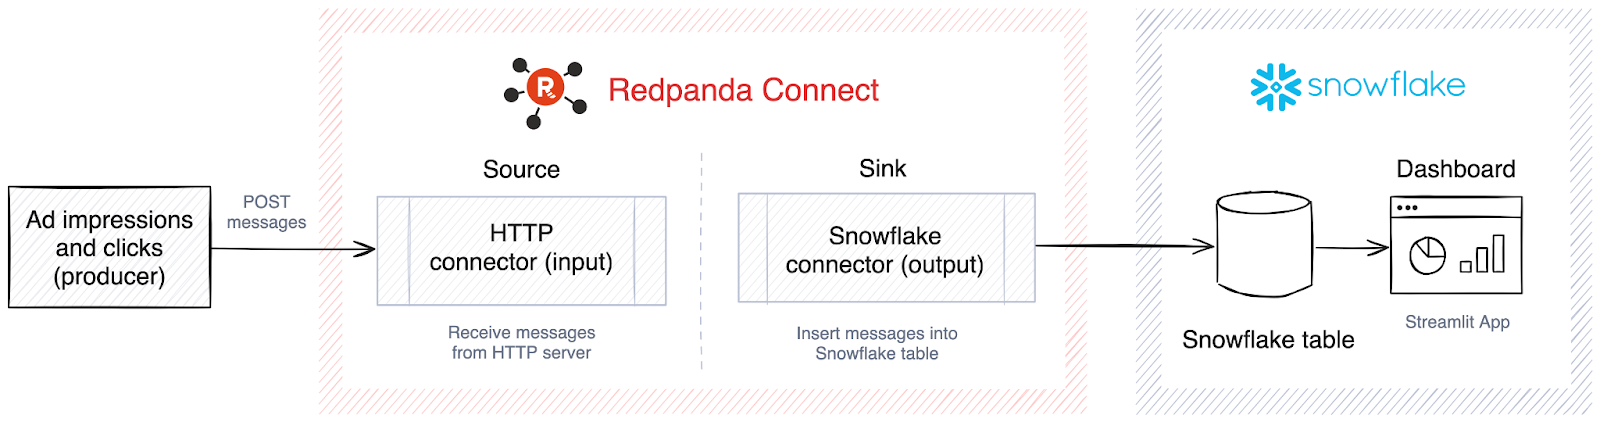
To build this real-time analytics system, you decide to use Redpanda and Snowflake:
Here’s how this system would work:
All the code from this tutorial is in this GitHub repository. To build it yourself step by step, read on.
You’ll need the following for this tutorial:
This tutorial uses Redpanda’s Docker-based, self-managed cluster, suitable for learning and testing purposes. With Windows or Mac, you can run the containers using Docker Desktop or any other alternative application.
Note: You can also use this quickstart to install the Redpanda cluster.
Download docker-compose.yml to set up a single-node Redpanda cluster. This tutorial uses a single-node setup, but in a production environment, it’s recommended that you use a cluster with three or more nodes.
To start the containers, execute docker compose up -d from your terminal. This will start your Redpanda cluster, and you can browse the console by going to https://localhost:8080/overview.
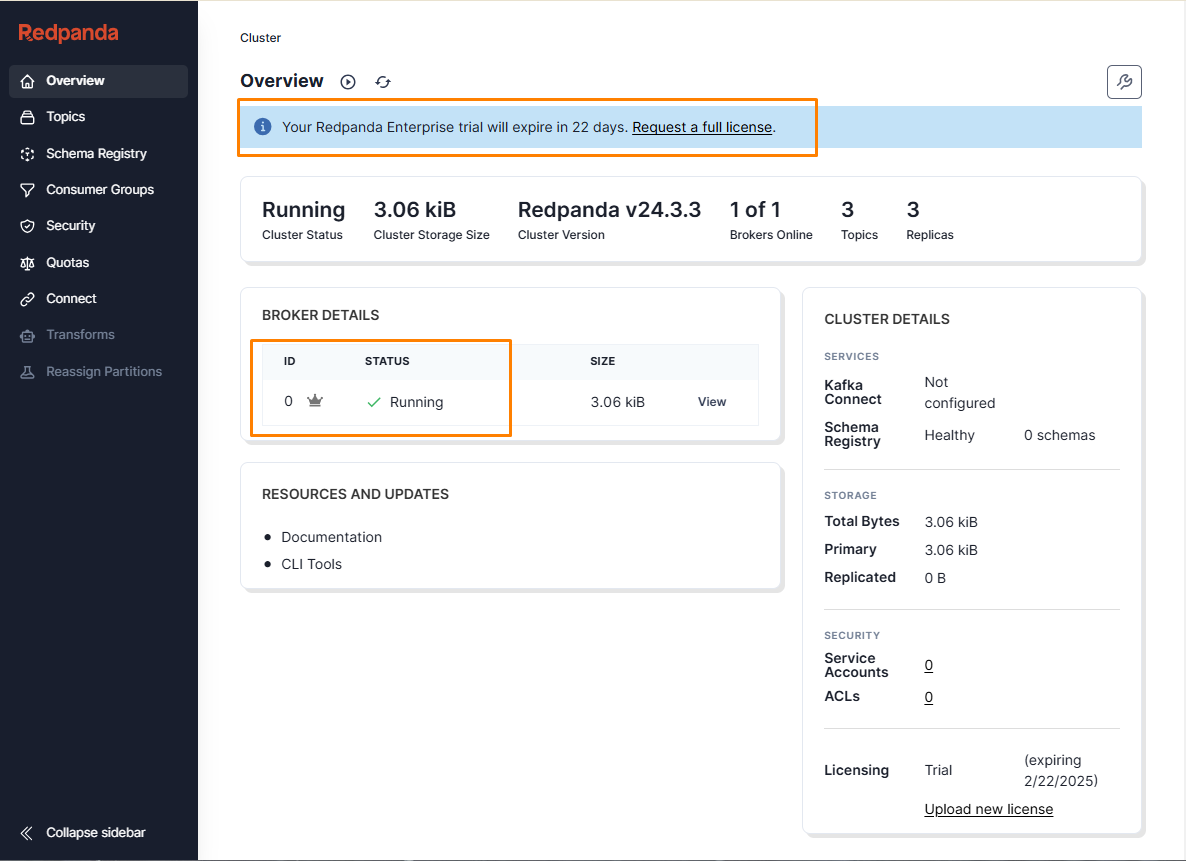
You should see the Redpanda Console overview page with the broker status as “running.”
To validate the Redpanda setup, execute docker exec -it redpanda-0 /bin/bash in your terminal to log in to the Redpanda cluster.
This will open the bash shell inside your Redpanda container. You’ll complete all the required configurations for the Redpanda Connect setup through this bash shell. But first, check if rpk—Redpanda’s command line interface tool for managing and configuring your Redpanda cluster—is installed with the following command:
rpk --version
This should return the rpk version.
Note: rpk comes preinstalled with the Redpanda Docker image; however, in case it’s not available or you want to update to the latest version, you can install/update it by following the steps given here.
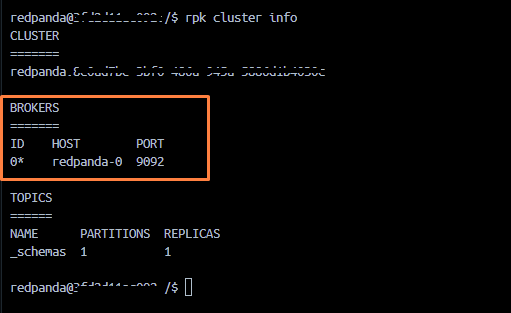
You can now validate the Redpanda configuration:
rpk cluster info
This should return the cluster status, indicating that Redpanda is installed and working fine.
For this tutorial, you need an enterprise license to integrate the Snowflake sink connectors in Redpanda Connect. You can sign up for a thirty-day trial license to explore these features. Once you receive the license file, you can add it to the cluster.
To do so, first open the terminal and copy the license file into the container by using the following command:
docker cp <full path on your local machine>/redpanda_license.txt redpanda-0:/tmp/rslicense
Apply the license file to the Redpanda cluster by executing the following command in the container’s bash shell:
rpk cluster license set --path /tmp/rslicense/redpanda_license.txt -X admin.hosts=http://redpanda-0:9644
Your console should show the applied trial license, as highlighted in the screenshot below:
If you face any issues while adding the license key, you can refer to this link.
To implement the example in this tutorial, you must log in to your Snowflake account to create a Snowflake database, schema, and virtual warehouse (compute engine) from the Snowflake UI.
Note: Before you start, make sure you have the right access permissions to create the required resources. For this tutorial, you can use the “ACCOUNTADMIN” role. However, you should use appropriate roles with the least required access permissions in actual projects.
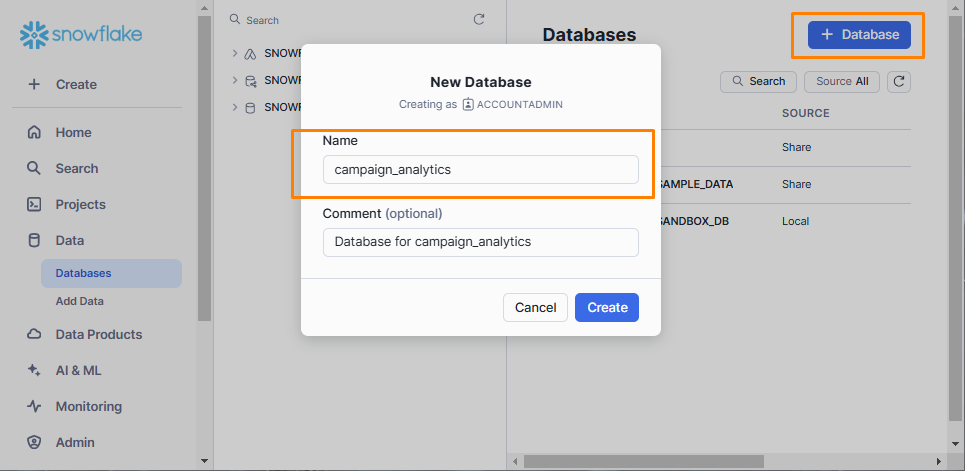
On the left-hand panel of the Snowflake dashboard, select Data > Databases. Click the + Database button in the top-right corner to create a new database. Give it the name campaign_analytics and click Create:
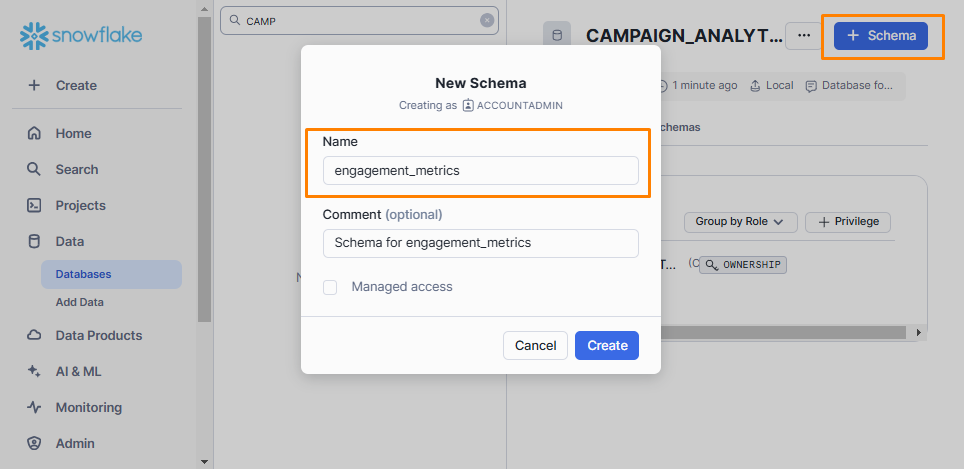
Visit Data > Databases again to view a list of available databases, then click the database created in the previous step to open a new panel. Click the + Schema button in the top-right corner to create a new schema. Name it engagement_metrics and click Create:
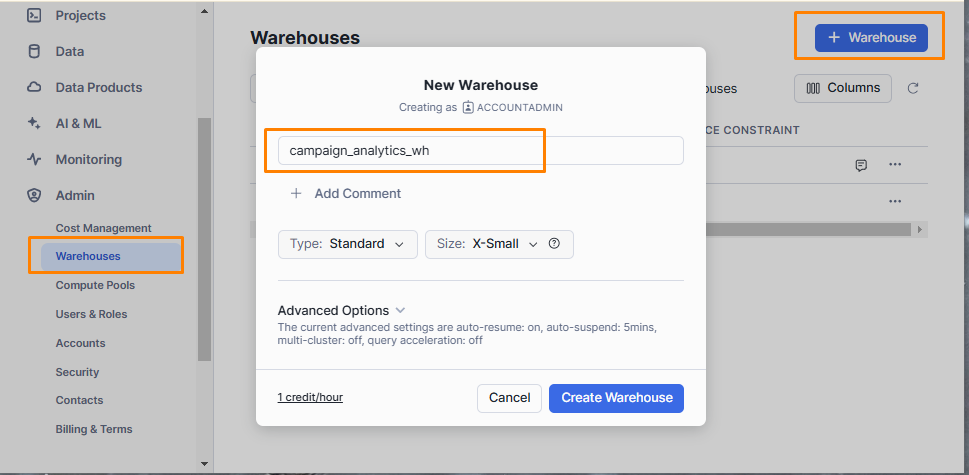
Visit Admin > Warehouses and click the + Warehouse button to create a new warehouse. Name it campaign_analytics_wh, then select “Standard” as the type and “X-Small” as the size from the drop-down menus. Finally, click Create Warehouse:
The last step within your Snowflake account is setting up the key-pair authentication. For this, you need to create a public and private key.
Open the terminal window from your local machine and execute the following to create a private key (without encryption):
openssl genrsa 2048 | openssl pkcs8 -topk8 -inform PEM -out rsa_key.p8 -nocryptYou’ll need this private key when setting up Redpanda Connect. Store it safely on your local machine.
Note: In production environments, you should add encryption for enhanced security.
To create a public key, execute the following command in your terminal:
openssl rsa -in rsa_key.p8 -pubout -out rsa_key.pubYou have to attach this public key to the Snowflake user that you’ll be using within Redpanda Connect. To create a new user, visit Admin > Users & Roles in the Snowflake dashboard and click the + User button. Enter a username and password. Under the “Advanced User Options” section, add the following details:
ACCOUNTADMINCAMPAIGN_ANALYTICS_WHCAMPAIGN_ANALYTICS.ENGAGEMENT_METRICS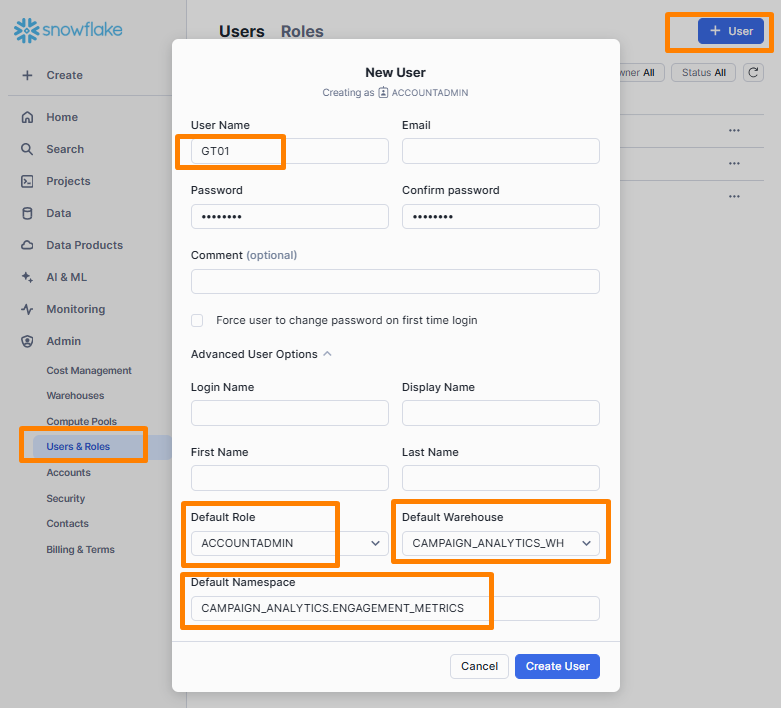
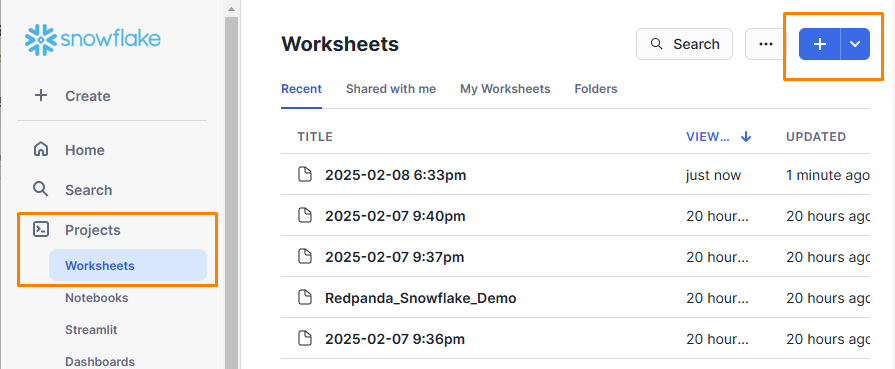
To open Snowflake’s query editor, go to Projects > Worksheets. Click the + button in the top-right corner to open a new worksheet where you can write queries:
In the query editor, execute the following command:
ALTER USER GT01 SET RSA_PUBLIC_KEY ="<PUBLIC KEY VALUE>"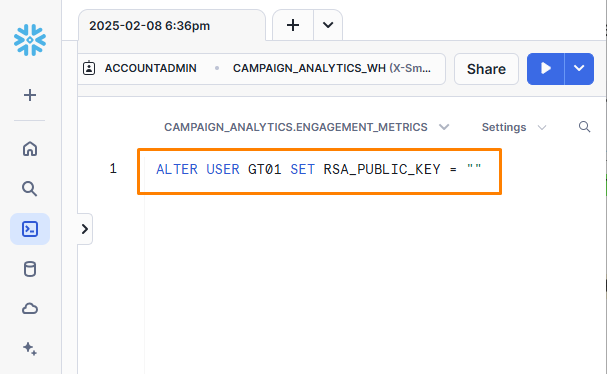
<PUBLIC KEY VALUE> in the above command is the public key without the header and footer that begins and ends with -----. This command assigns the public key to the GT01 user created earlier.
This completes your Snowflake setup. If you run into issues setting up the key pair, refer to the Snowflake documentation.
Note: This tutorial uses the Snowflake UI to execute these commands. Alternatively, you can execute these commands using SnowSQL (Snowflake’s CLI). You can refer to the Snowflake quick start guide for SnowSQL commands.
Redpanda Connect provides out-of-the-box connectors for connecting to the HTTP server as a source (input) and Snowflake as a sink (output). To configure Redpanda Connect, you’ll first need to log in to the Redpanda cluster and create a directory:
mkdir /tmp/campaign_analyticsYou can use this as the working directory to store all files required for this tutorial.
Run the following command in your terminal, ensuring the path to the private key matches your system, to copy the previously generated key from your local machine to the Docker environment:
docker cp D:\sf\rsa_key.p8 redpanda-0:/tmp/campaign_analytics/rsa_key.p8The next step is to create a Redpanda Connect config file that receives messages from the HTTP source and sends them to Snowflake. To create the config file, you’ll need to:
Note: The HTTP input and Snowflake output configuration details will be stored in a single Redpanda Connect config file. This config file has a .yaml extension and is required for data movement between HTTP and Snowflake.
To configure the HTTP connector, use the following template:
input:
  label: ""
  http_server:
    address: "" # Uses default server if left blank
    path: /post

    allowed_verbs:
      - POST
    timeout: 5s
    rate_limit: ""
The address field is used to add the HTTP server details. To keep things simple, this tutorial uses Redpanda Connect’s default server as input. Based on your use case, you can configure the input connector to receive messages from a wide variety of input components.
Redpanda Connect offers snowflake_streaming connector to configure Snowflake as the output.
The snowflake_streaming connector uses the Snowpipe Streaming API, which supports low latency loading of streaming data rows into Snowflake tables. It also offers better performance for streaming data.
You can configure snowflake_streaming using the following template:
output:
  label: ""
  snowflake_streaming:
    account: ORG-ACCOUNT # No default (required)
    user: "" # No default (required)
    role: ACCOUNTADMIN # No default (required)
    database: MYDATABASE # No default (required)
    schema: PUBLIC # No default (required)
    table: MYTABLE # No default (required)
    private_key: "" # No default (optional)
    private_key_file: "" # No default (optional)
    private_key_pass: "" # No default (optional)
    mapping: "" # No default (optional)
    init_statement: | # No default (optional)
      CREATE TABLE IF NOT EXISTS mytable (amount NUMBER);
    schema_evolution:
      enabled: false # No default (required)
Update this template as follows:
label of the configuration to sf_configaccount using the format <orgname>-<account_name>user to run the stream as GT01role is the role of the user specified in the user field; set its value to ACCOUNTADMINdatabase is the Snowflake database you want to write data to; set its value to CAMPAIGN_ANALYTICSschema is the schema within the Snowflake database you want to write data to; set its value to ENGAGEMENT_METRICStable is the Snowflake table you want to write data to and where the stream will load the input messages; set its value to AD_RAW_DATAprivate_key is the PEM-encoded private RSA key to use for authentication with Snowflake; you can ignore private_key if you set the private key file in the next parameterprivate_key_file is the PEM-encoded file to load the private RSA key from; set its value to /tmp/campaign_analytics/rsa_key.p8, and include the complete path of the private keyprivate_key_pass only if you provided any passphrase value when creating the private key; otherwise, leave it as ismapping (for this tutorial, you can ignore this parameter)init_statement includes optional SQL statements to execute immediately after this output connects to Snowflake for the first time; set it to the Snowflake table creation commandschema_evolution is required for controlling table schema updates; this example keeps it false because we're not going to change the schema. However, ideally you should enable it for use cases where you’re expecting source-side schema changes.You can explore other options based on your use case.
Note: Remember, you need an enterprise license for this Snowflake connector, which you saw how to apply in the “Set up a Redpanda cluster” section. If you're not using the Docker image, you can find licensing instructions [here](https://docs.redpanda.com/redpanda-connect/get-started/licensing/)
As mentioned, you need to save these details in a config file. Create a new file named http_sf_stream.yaml in /tmp/campaign_analytics and view the contents of this file using this command:
cat /tmp/campaign_analytics/http_sf_stream.yaml
The config file should look like this:
input:
  label: "http_config"
  http_server:
    address: ""
    path: /post
    ws_path: /post/ws
    allowed_verbs:
      - POST
    timeout: 5s
    rate_limit: ""

output:
  label: "sf_config"
  snowflake_streaming:
    account: "<Snowflake Account>"  # Update with your Snowflake account in <orgname>-<account_name> format
    user: "GT01"
    role: "ACCOUNTADMIN"
    database: "CAMPAIGN_ANALYTICS"
    schema: "ENGAGEMENT_METRICS"
    table: "AD_RAW_DATA"
    private_key_file: "./rsa_key.p8"
    private_key_pass: ""
    # mapping: ""
    init_statement: |
      CREATE TABLE IF NOT EXISTS AD_RAW_DATA ( AD_ID NUMBER, AD_IMPRESSIONS NUMBER, AD_CLICKS NUMBER, AD_CONVERSIONS NUMBER );
    schema_evolution:
      enabled: false
Take note of the name of this configuration file without the .yaml extension (http_sf_stream), as you’ll need it to start the Redpanda Connect stream process.
The final step in this setup is to create the Streamlit app in Snowflake. Streamlit is an app framework that helps you build high-quality apps using just a few lines of Python code. It’s available within the Snowflake environment and can help you quickly build, deploy, and share data applications.
On the left-hand panel in the Snowflake dashboard, select Projects > Streamlit, then click the + Streamlit App button.
Configure the new Streamlit app as follows:
CAMPAIGN ANALYTICS APPCAMPAIGN_ANALYTICS and ENGAGEMENT_METRICS from the drop-down menusCAMPAIGN_ANALYTICS_WH from the drop-down menu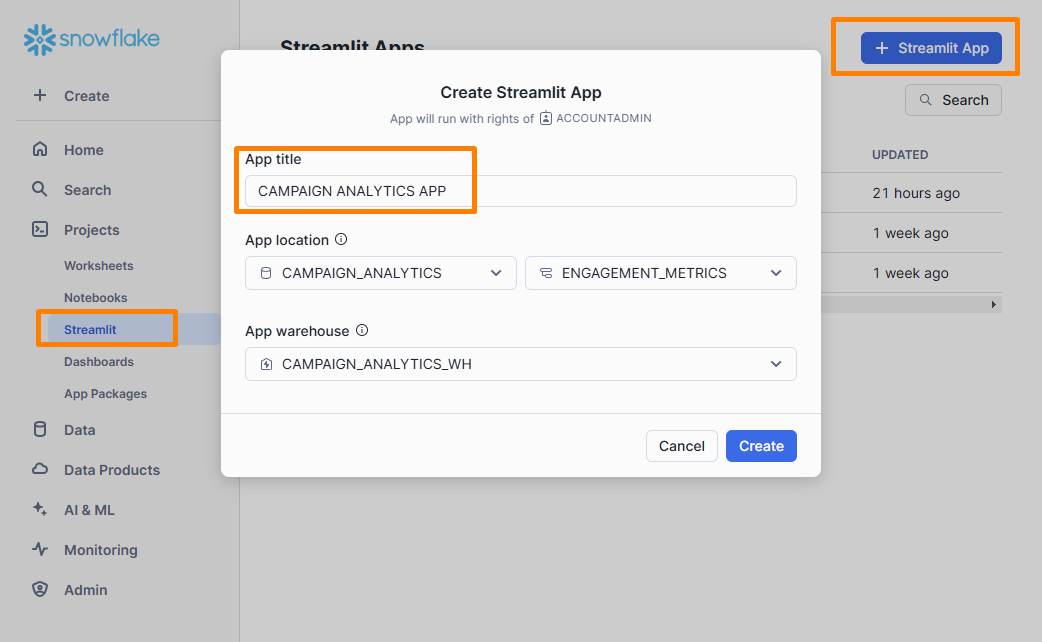
Click Create to open two new windows. The left window will have the default Streamlit app code (written in Python), and the right window will show the app visualizations based on the code logic.
You can replace the default Python code with the following snippet to read data from the AD_RAW_DATA table:
# Import Python packages
import streamlit as st
from snowflake.snowpark.context import get_active_session

# Write directly to the app
st.title(" :blue[Campaign Analytics]" )
st.write(
    """ *** Engagement Metrics Dashboard *** """
)

# Get the current credentials
session = get_active_session()

# Calculate the sum of ad impressions
impressions_data = session.sql("select AD_ID,SUM(AD_IMPRESSIONS) AS TOTAL_IMPRESSIONS from CAMPAIGN_ANALYTICS.ENGAGEMENT_METRICS.AD_RAW_DATA group by AD_ID")

# Execute the query and convert it into a pandas DataFrame
queried_impressions_data = impressions_data.to_pandas()


# Calculate the sum of ad clicks
clicks_data = session.sql("select AD_ID,SUM(AD_CLICKS) AS TOTAL_CLICKS from CAMPAIGN_ANALYTICS.ENGAGEMENT_METRICS.AD_RAW_DATA group by AD_ID")

# Execute the query and convert it into a pandas DataFrame
queried_clicks_data = clicks_data.to_pandas()

a, b = st.columns(2)
with a:
    st.subheader("Impressions per ad")
    st.bar_chart(data=queried_impressions_data, x="AD_ID", y="TOTAL_IMPRESSIONS", color="#f4e941")
with b:
    st.subheader("Clicks per ad")
    st.bar_chart(data=queried_clicks_data, x="AD_ID", y="TOTAL_CLICKS", color="#4ece09")


# Ad with max & min clicks
ad_max_clicks = session.sql("select AD_ID, sum(AD_CLICKS) AS total_clicks from  CAMPAIGN_ANALYTICS.ENGAGEMENT_METRICS.AD_RAW_DATA group by AD_ID order by total_clicks desc limit 1")
ad_min_clicks = session.sql("select AD_ID, sum(AD_CLICKS) AS total_clicks from  CAMPAIGN_ANALYTICS.ENGAGEMENT_METRICS.AD_RAW_DATA group by AD_ID order by total_clicks asc limit 1")
max_clicks_data = ad_max_clicks.to_pandas()
min_clicks_data = ad_min_clicks.to_pandas()


a, b = st.columns(2)
with a:
    st.subheader("Ad with maximum clicks")
    st.dataframe(max_clicks_data, use_container_width=True)
with b:
    st.subheader("Ad with minimum clicks")
    st.dataframe(min_clicks_data, use_container_width=True)


# Calculate the click-through rate
ctr_data = session.sql("select AD_ID, ROUND(SUM(AD_CLICKS)/SUM(AD_IMPRESSIONS) * 100,2) AS CTR_PERCENTAGE from CAMPAIGN_ANALYTICS.ENGAGEMENT_METRICS.AD_RAW_DATA group by AD_ID order by CTR_PERCENTAGE desc ")
queried_ctr_data = ctr_data.to_pandas()

st.subheader("CTR per ad")
st.dataframe(queried_ctr_data, use_container_width=True)
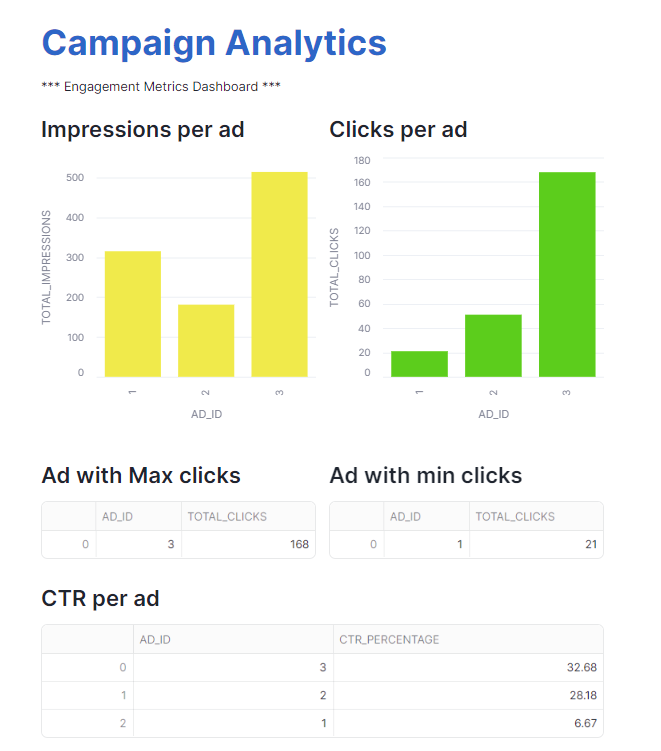
This code reads data from the AD_RAW_DATA table and displays the following visualizations:
You’ve now completed the Redpanda–Snowflake integration to ingest real-time messages and generate insights in the Streamlit app. In the next step, you’ll validate this integration.
You can run the Redpanda Connect stream and POST some test records to the HTTP server. As records are posted, they’ll appear in the Snowflake table in real time.
Execute the following command from the Docker bash shell (in the campaign_analytics directory) to start Redpanda Connect in streams mode, which ensures that this pipeline is isolated if you want to add additional pipelines in the future:
rpk connect streams http_sf_stream.yamlIt will start receiving data continuously, which is posted to the HTTP server.
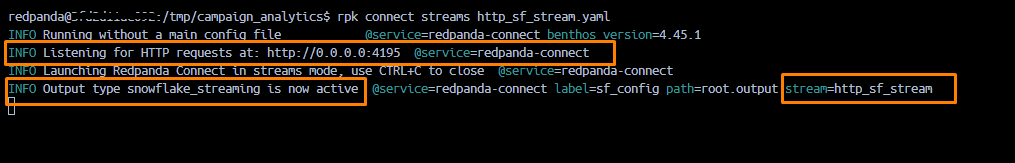
The screen output shows that the connector listens to messages on the HTTP server, and the snowflake_streaming output is active.
To check if the stream is active and running, open your Docker bash shell by executing docker exec -it redpanda-0 /bin/bash, and once inside the bash shell, execute the following:
curl http://localhost:4195/streams/http_sf_streamNote: In the above command,localhost:4195is the URL of the default HTTP server, andhttp_sf_streamis the stream name.
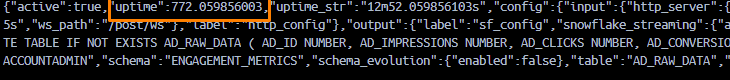
If the screen output shows the stream uptime along with the input and output config details, it indicates that your stream has started:
For testing, you can use the following curl command from the Docker bash shell to send test records:
curl <HTTP endpoint> -d '<Test data in JSON format>'To send messages to the stream, run the following commands one by one:
Post message 1:
curl http://localhost:4195/http_sf_stream/post -d '{"AD_ID":"1","AD_IMPRESSIONS":315,"AD_CLICKS":21,"AD_CONVERSIONS":3}'Post message 2:
curl http://localhost:4195/http_sf_stream/post -d '{"AD_ID":"2","AD_IMPRESSIONS":181,"AD_CLICKS":51,"AD_CONVERSIONS":11}'Post message 3:
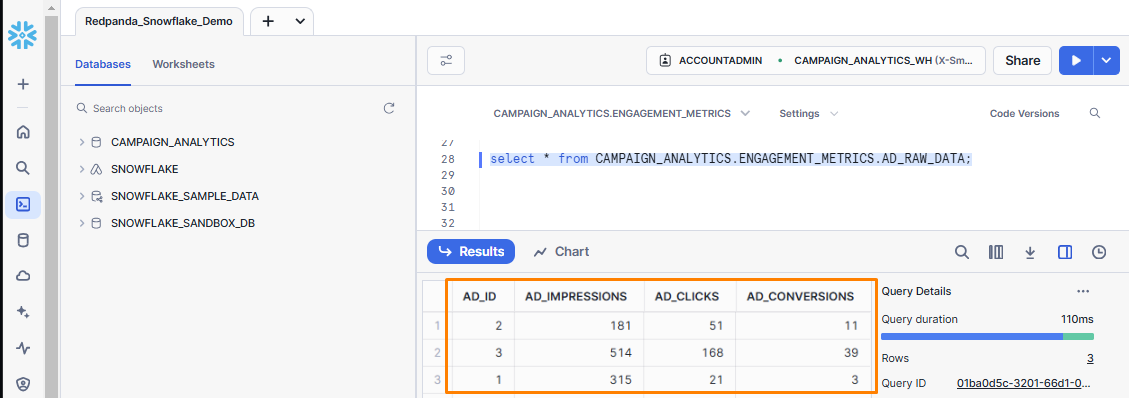
curl http://localhost:4195/http_sf_stream/post -d '{"AD_ID":"3","AD_IMPRESSIONS":514,"AD_CLICKS":168,"AD_CONVERSIONS":39}'Go to the Snowflake dashboard and query the AD_RAW_DATA table to validate if records have been ingested in Snowflake. The table should show the three records posted using the stream http_sf_stream:
You can now run your Streamlit app and view the final dashboard with the visualizations mentioned earlier:
With this, you’ve completed the setup for real-time campaign analytics. Before testing the full workflow, delete the test records from the Snowflake table using the following command in the Snowflake query editor:
DELETE FROM CAMPAIGN_ANALYTICS.ENGAGEMENT_METRICS.AD_RAW_DATA
WHERE AD_ID IN (1, 2, 3);Let’s test this setup by running a simple script that sends messages every five seconds.
In your terminal, open the container’s bash shell by executing the command below:
docker exec -it redpanda-0 /bin/bashStart Redpanda Connect in streams mode using this command:
cd /tmp/campaign_analytics
rpk connect streams http_sf_stream.yaml
Open another terminal window and open the container’s bash shell with the following command:
docker exec -it redpanda-0 /bin/bashExecute the producer script that POSTs ad impressions and clicks for five different ads every five seconds. This script will stop after sending a total of 500 messages:
cd /tmp/campaign_analytics
sh produce_messages.shNote: You can edit this script to add more test records or just copy these curl commands to post individual messages according to your requirements.
Open the Streamlit app and view the dashboards. You can refresh it to see the updates in real time. Once the producer script is completed, your final dashboard will look like this:

The dashboard should now include two bar charts showing the impressions and clicks per ad. You can see that ad 5 received the most clicks and ad 2 the least. Below the charts, three tables highlight the ads with the highest and lowest clicks, as well as the click-through rates for each ad. Notably, ad 5 has a CTR exceeding 50 percent, indicating strong user engagement.
Congratulations! You just learned the fastest and easiest way to implement digital advertising real-time analytics by moving data (in real time) from an HTTP server to Snowflake.
You can play with similar setups to ingest data in real time from various source systems using any of Redpanda Connect’s growing suite of connectors. Check the list of code components, producer script, and configurations in this GitHub repository.
To get started with Redpanda, try Redpanda for free. If you have any questions or need help, join the Redpanda Community Slack to chat with our engineers.
Subscribe to our VIP (very important panda) mailing list to pounce on the latest blogs, surprise announcements, and community events!
Opt out anytime.