


Deploy agents you can trust with centralized AI governance
You can't scale what you can't trust. A governance layer fixes that.
.png)
Learn how Redpanda delivered a game-changing performance boost for Chess.com


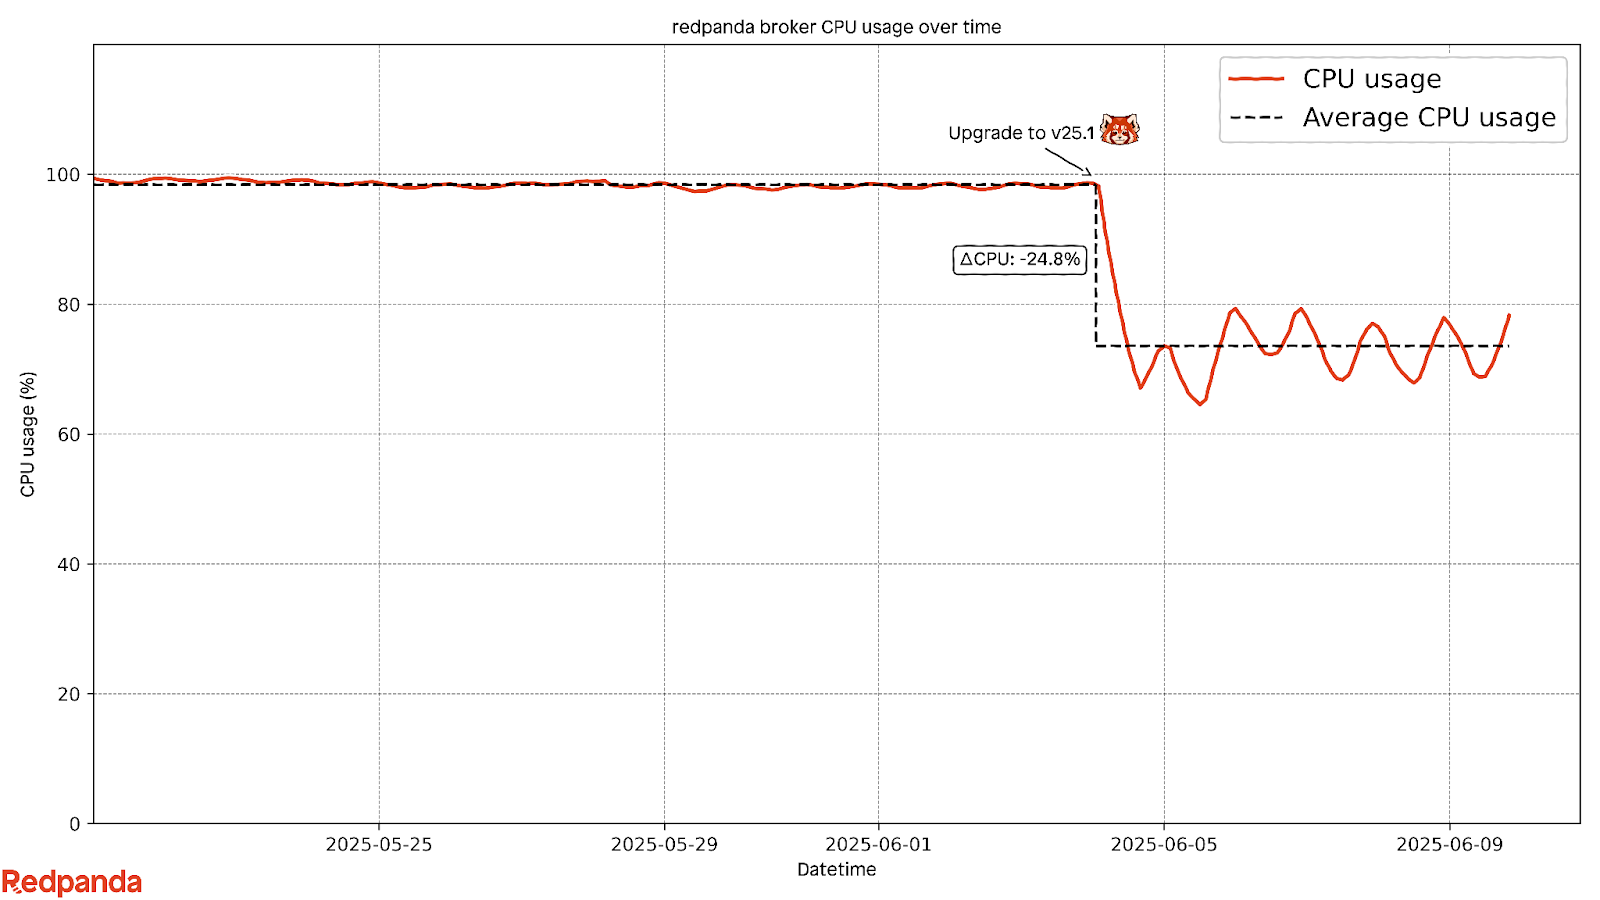
Redpanda used observability to identify the exact area where their system could be more efficient. They discovered that the issue was with the compaction process on compressed data. With the insights from their observability platform, they implemented improvements introduced in Redpanda version 25.1, which included smarter controls that determine when and how compaction should run. This led to a major performance boost.
Redpanda provides several resources for setting up observability and optimizing performance. These include guides on how to set up observability for Redpanda, batch tuning in Redpanda for optimized performance, best practices for tuning and monitoring Redpanda, and how to monitor Redpanda Connect.
Chess.com, which hosts over ten million chess games daily, was facing a significant performance issue. One of their largest data streams was consuming an excessive amount of CPU, putting pressure on their real-time infrastructure. The issue was traced to compaction on compressed data, which was running inefficiently and too frequently, using more resources than necessary. This problem was identified through Redpanda's dashboards and monitoring tools.
The improvements made by Redpanda resulted in immediate and dramatic results. CPU usage dropped sharply across the entire system, latency was cut nearly in half, and the system became more stable with fewer spikes in usage or risk of overload. Additionally, compaction was now running at the right times, on the right data, with much less effort.
Observability is a key part of Redpanda's strategy because it allows them to spot issues early and solve them confidently. It also enables them to continuously improve their product, ensuring every customer benefits from smarter defaults and better performance. Furthermore, it allows them to validate every change through real-world customer outcomes, not just benchmarks or theory.
At Redpanda, one of our guiding principles is this: you can't improve what you can't see. That’s why observability is at the heart of how we support customers, design features, and roll out improvements.
Recently, we collaborated with Chess.com — the world’s largest chess website with over 200 million members. As the #1 hub for online chess, this powerhouse platform hosts more than ten million chess games every day. However, they were experiencing a significant performance issue: one of their largest data streams was consuming an excessive amount of CPU, placing pressure on their real-time infrastructure.
Here’s how we used observability to diagnose the problem, improve our product, and deliver a major performance boost — all with zero downtime.
The customer was running a critical data stream that had grown to a massive size: tens of terabytes. Over time, it began using more and more CPU, threatening the health of their entire system.
Through our dashboards and monitoring tools, we traced the problem to one core area: compaction on compressed data — the process of cleaning up old or duplicate records in the stream. It was running inefficiently and too frequently, using far more resources than necessary.
Thanks to the insights from our observability platform, we were able to identify exactly where our system could be more efficient. The good news? We had just introduced improvements in Redpanda version 25.1 — including smarter controls that determine when and how compaction should run.
With the customer’s consent, we scheduled a safe and seamless upgrade. Our team closely monitored every step of the rollout, using real-time metrics to track performance, resource usage, and system health.
The results were immediate and dramatic:
Even better, we saw that compaction was now running at the right times, on the right data, with much less effort — exactly as intended.
The Grafana chart below illustrates the significant reduction in CPU utilization on a single broker within the cluster.
This wasn’t a lucky move — it was observability playing chess, not checkers. Nor is this a story about simply fixing one issue, but a reflection of how we operate at Redpanda:
For this customer, the fix meant smoother gameplay experiences and more efficient infrastructure. For us, it was a reminder that sometimes the biggest wins come from small, smart changes — made visible through great observability.
So if you're running large-scale data streams and want better performance with fewer headaches, get in touch or check out these handy resources:
You can't scale what you can't trust. A governance layer fixes that.
Your lakehouse mirrors the database, instantly.

What is it, why enterprises need it, and how to evaluate one
Subscribe to our VIP (very important panda) mailing list to pounce on the latest blogs, surprise announcements, and community events!
Opt out anytime.